Filter

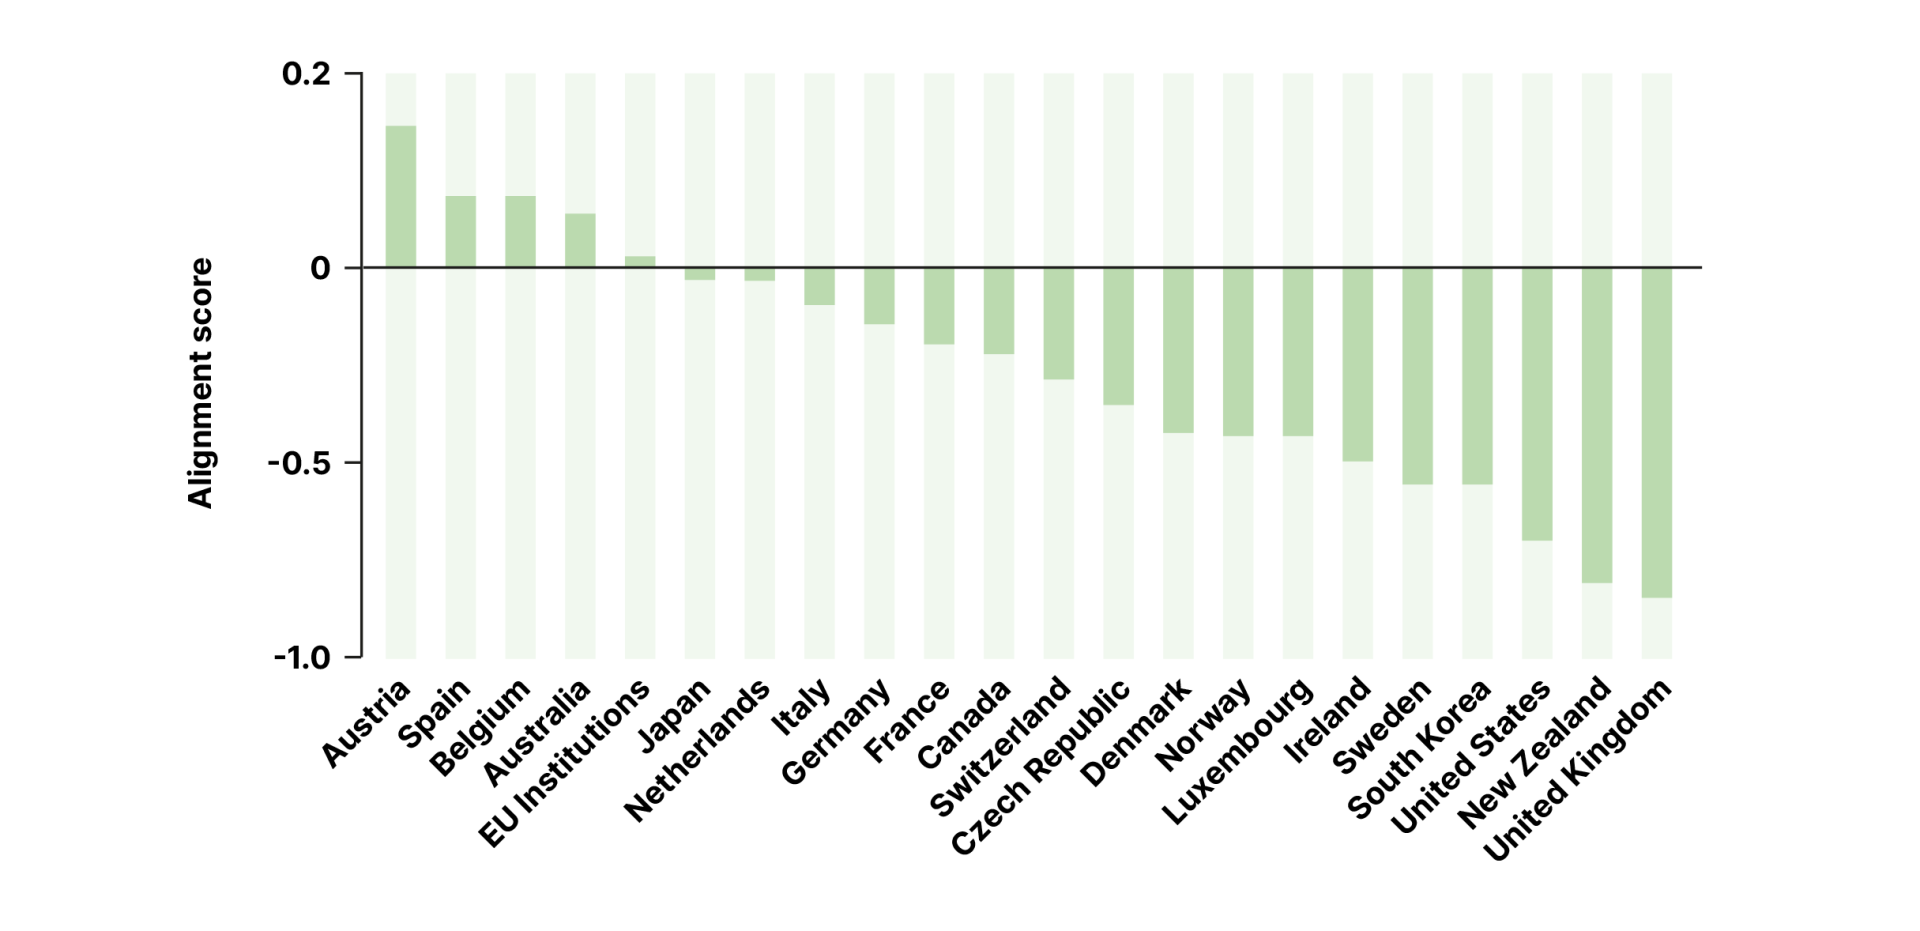
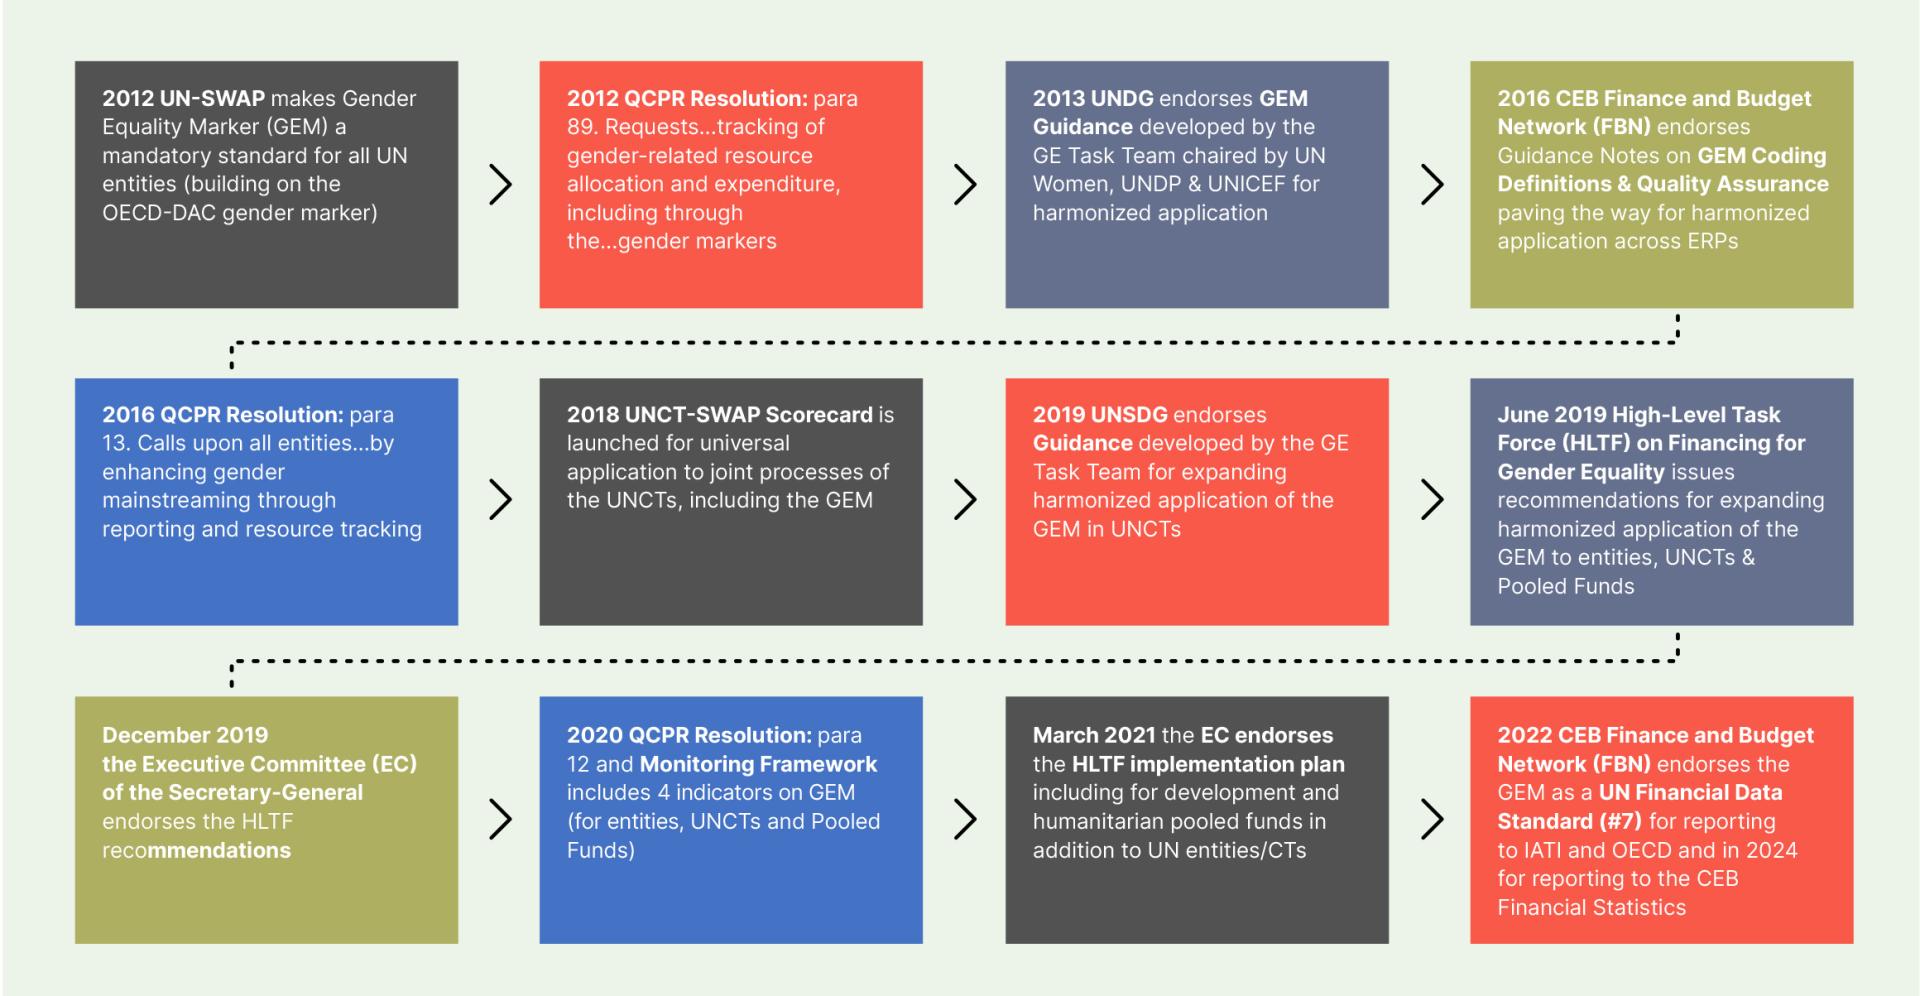
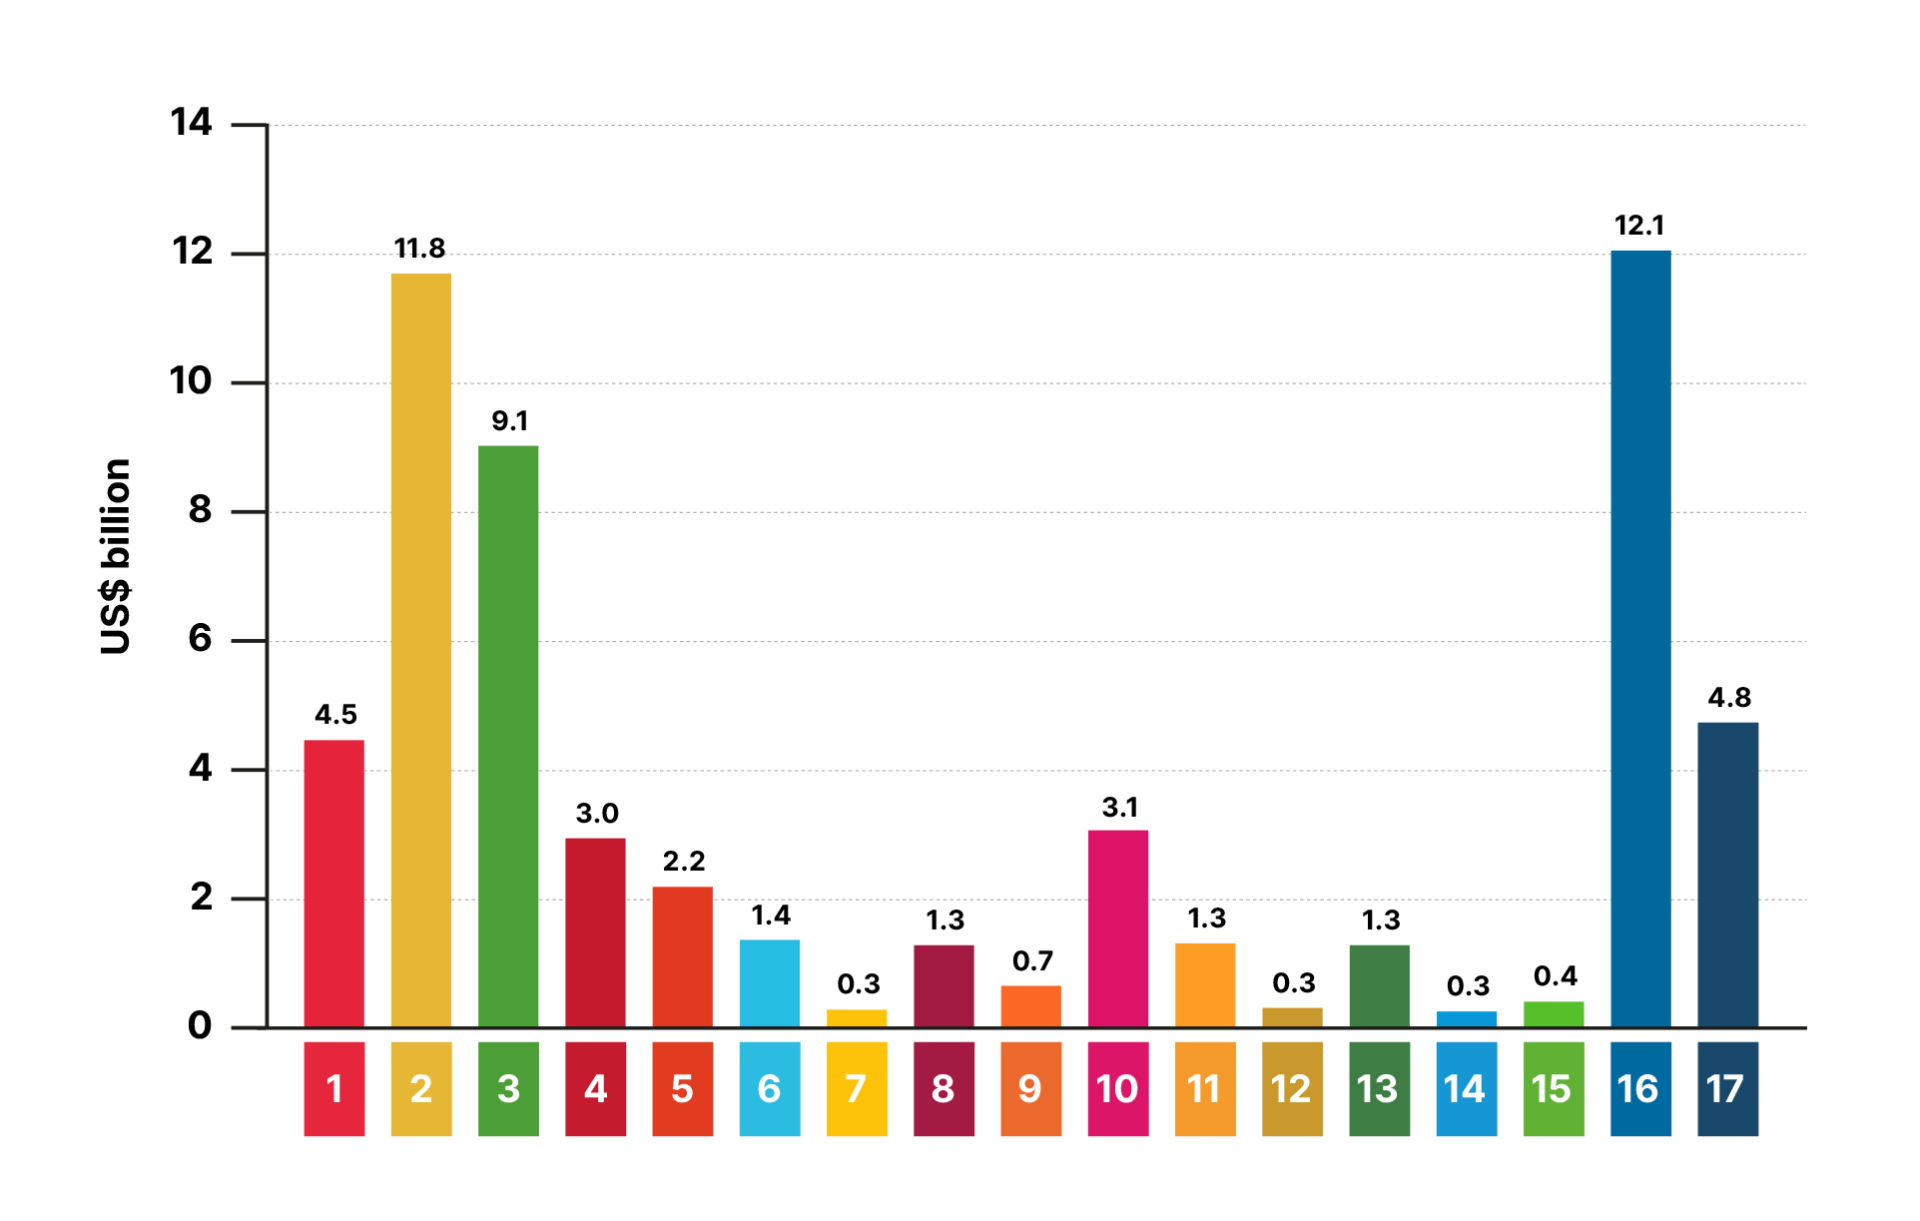
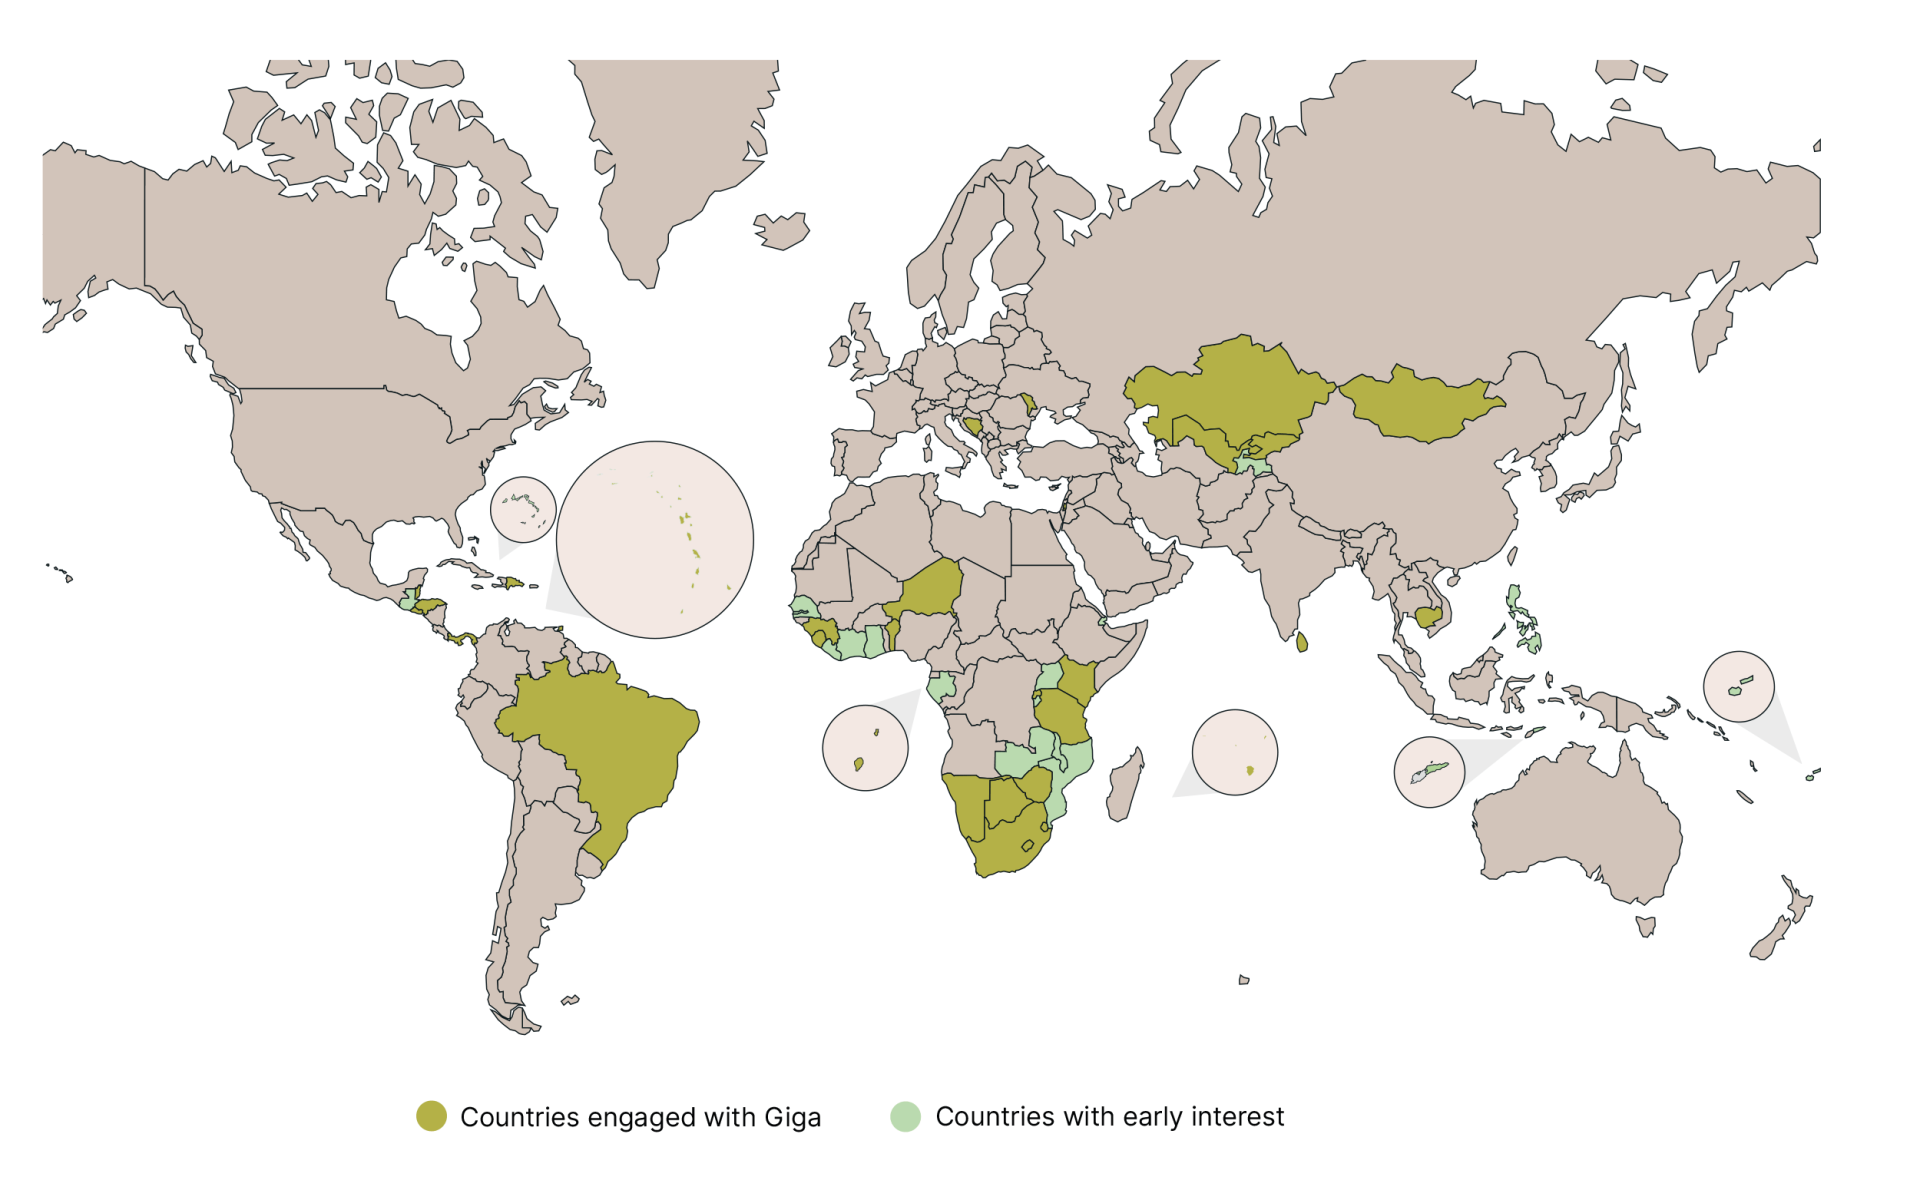

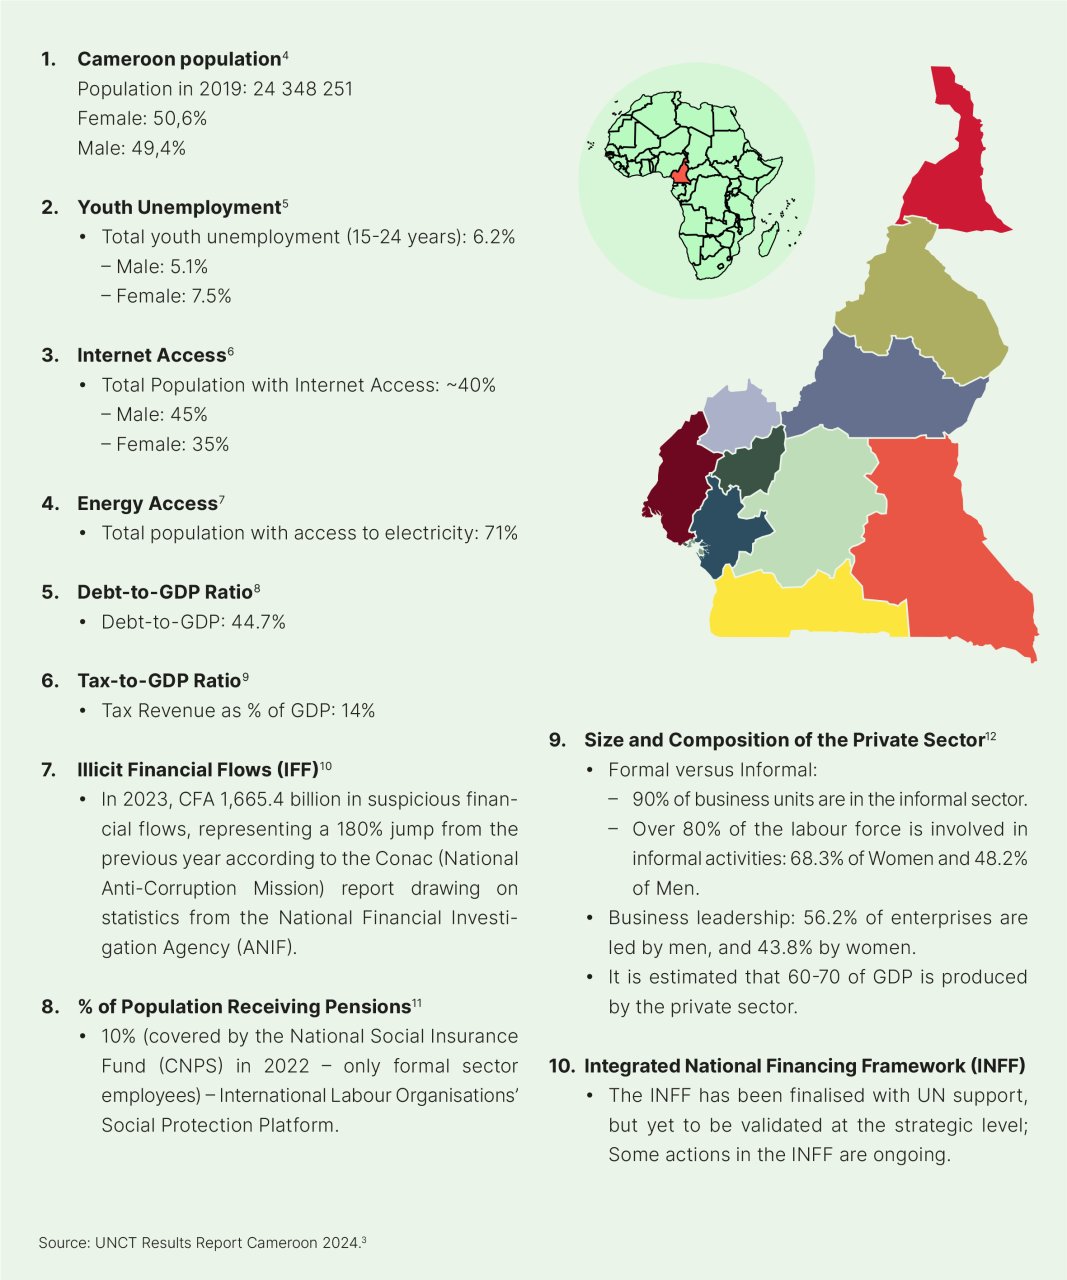


Figure 38
UN system expenses by function, 2023
Figure 39
CEB member organisations

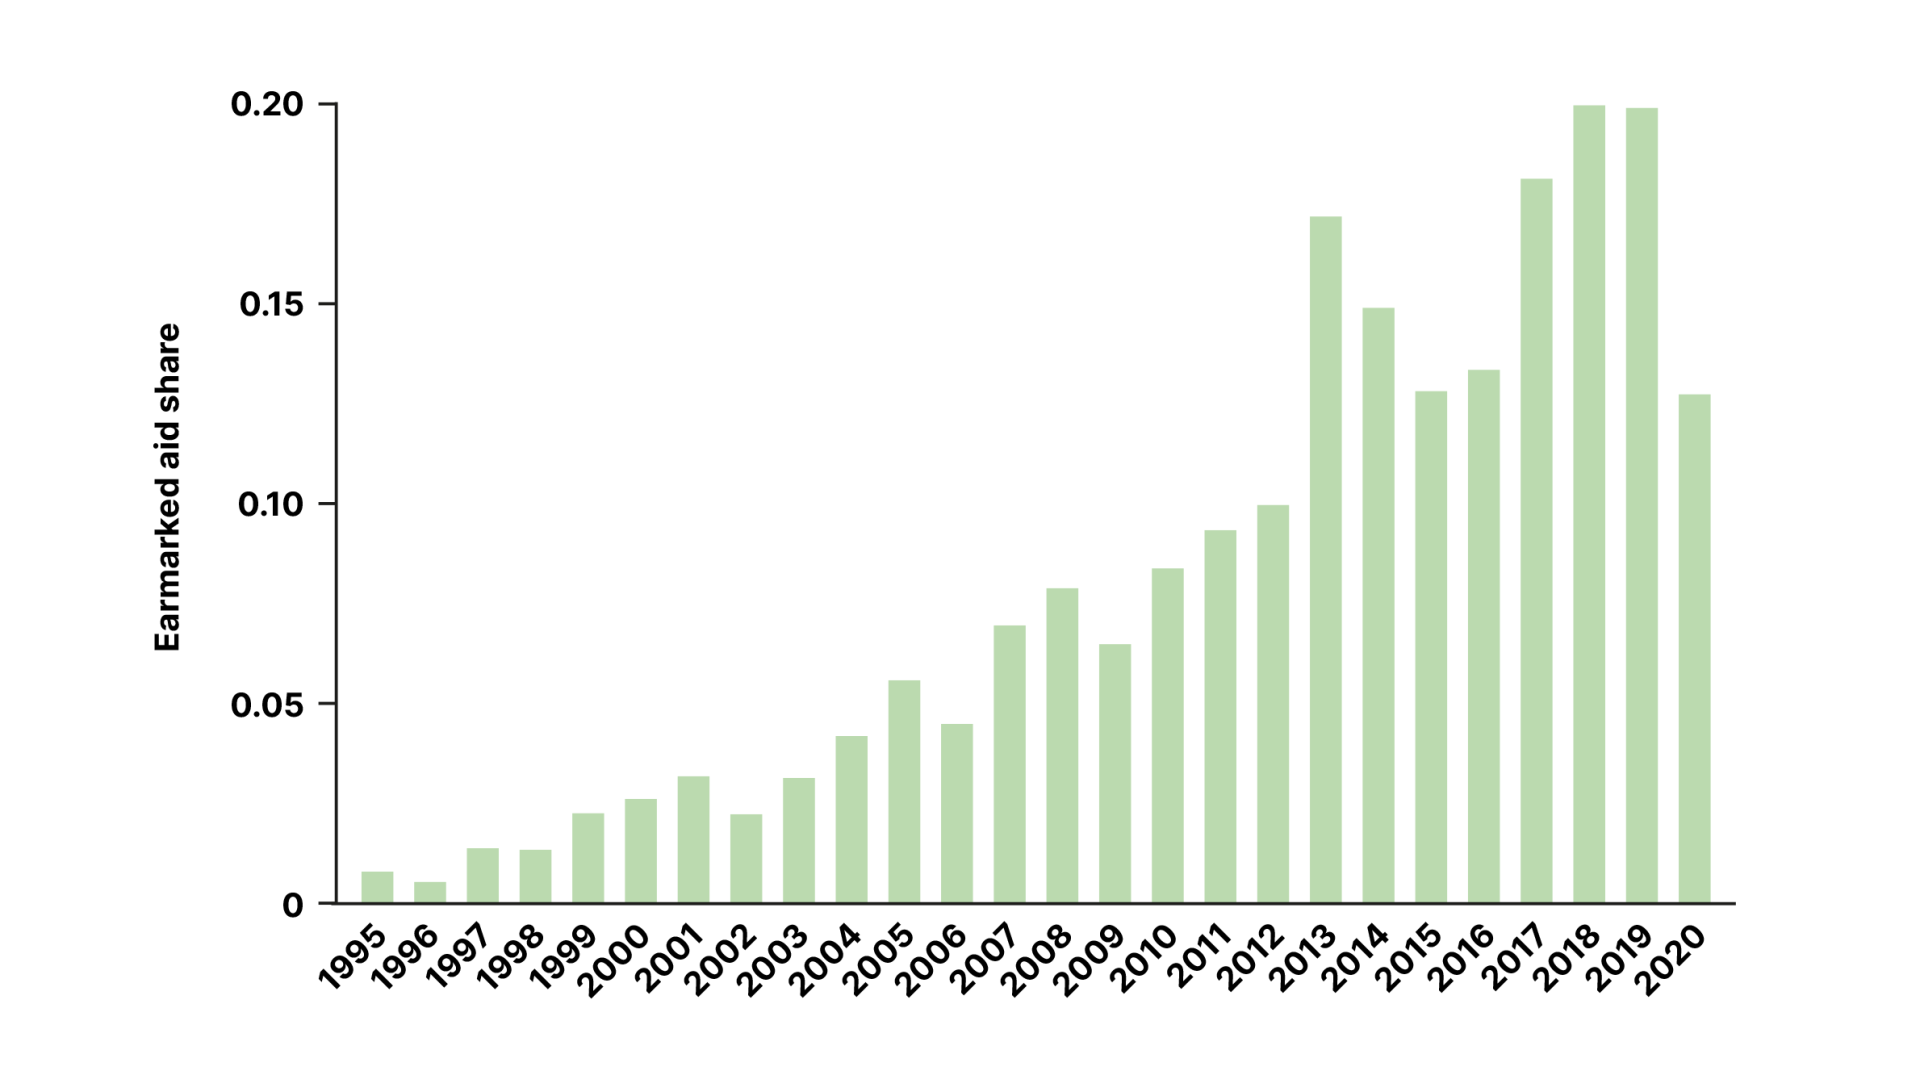
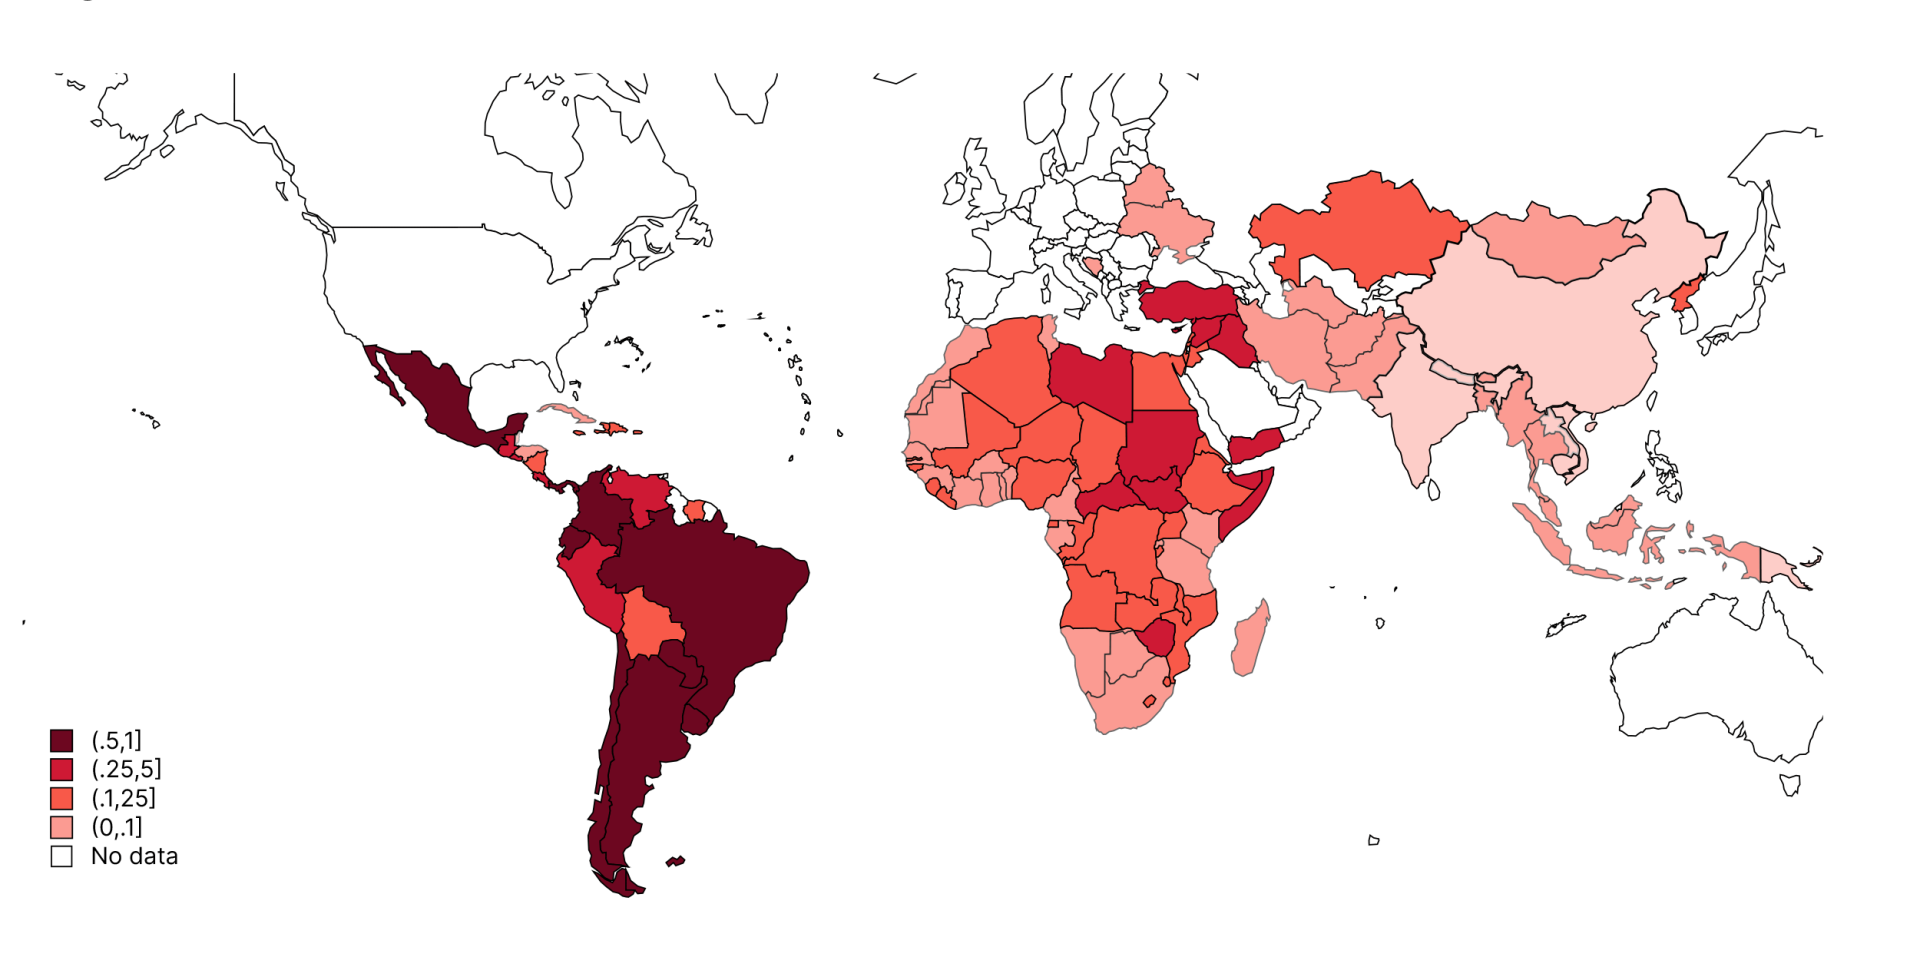
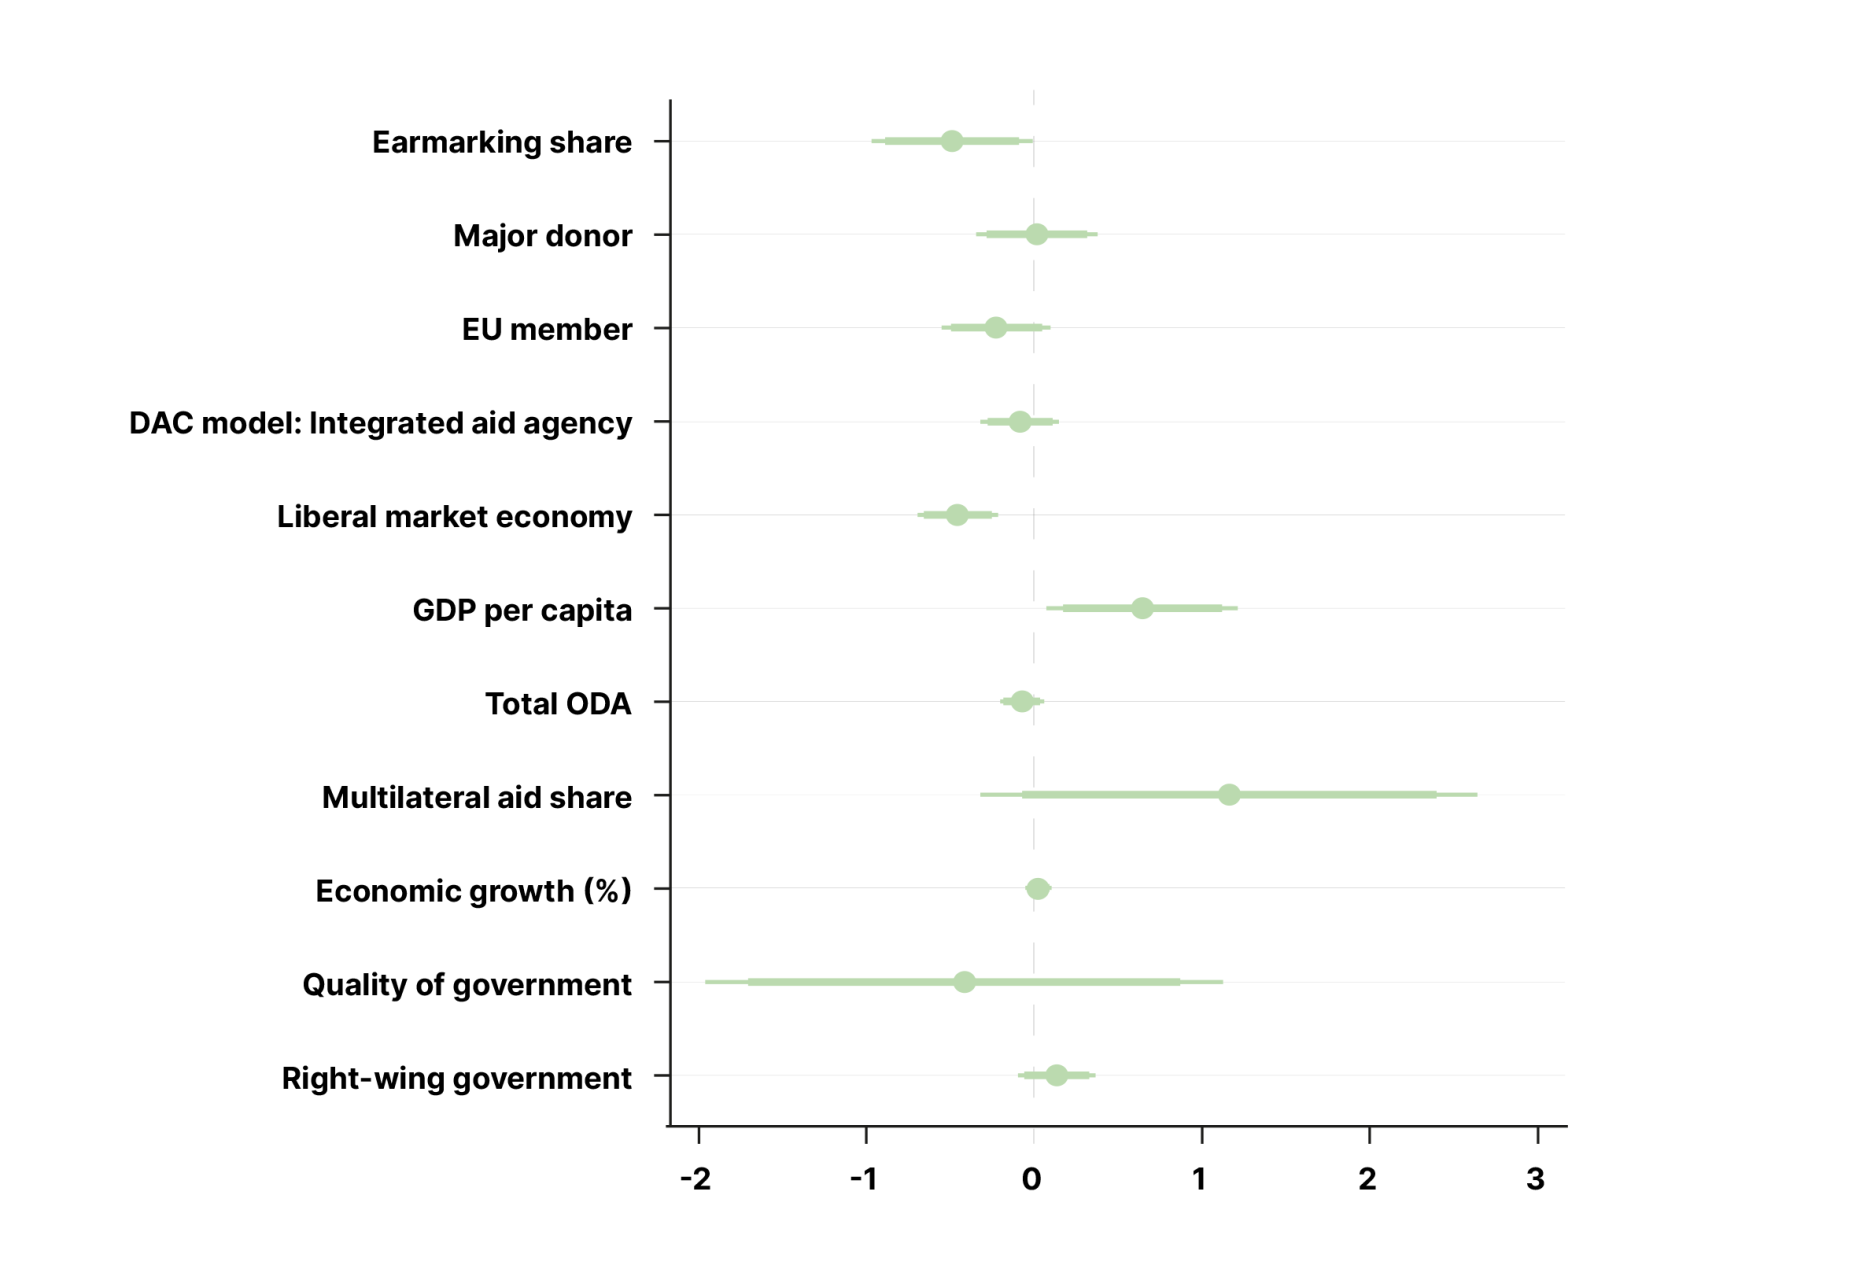
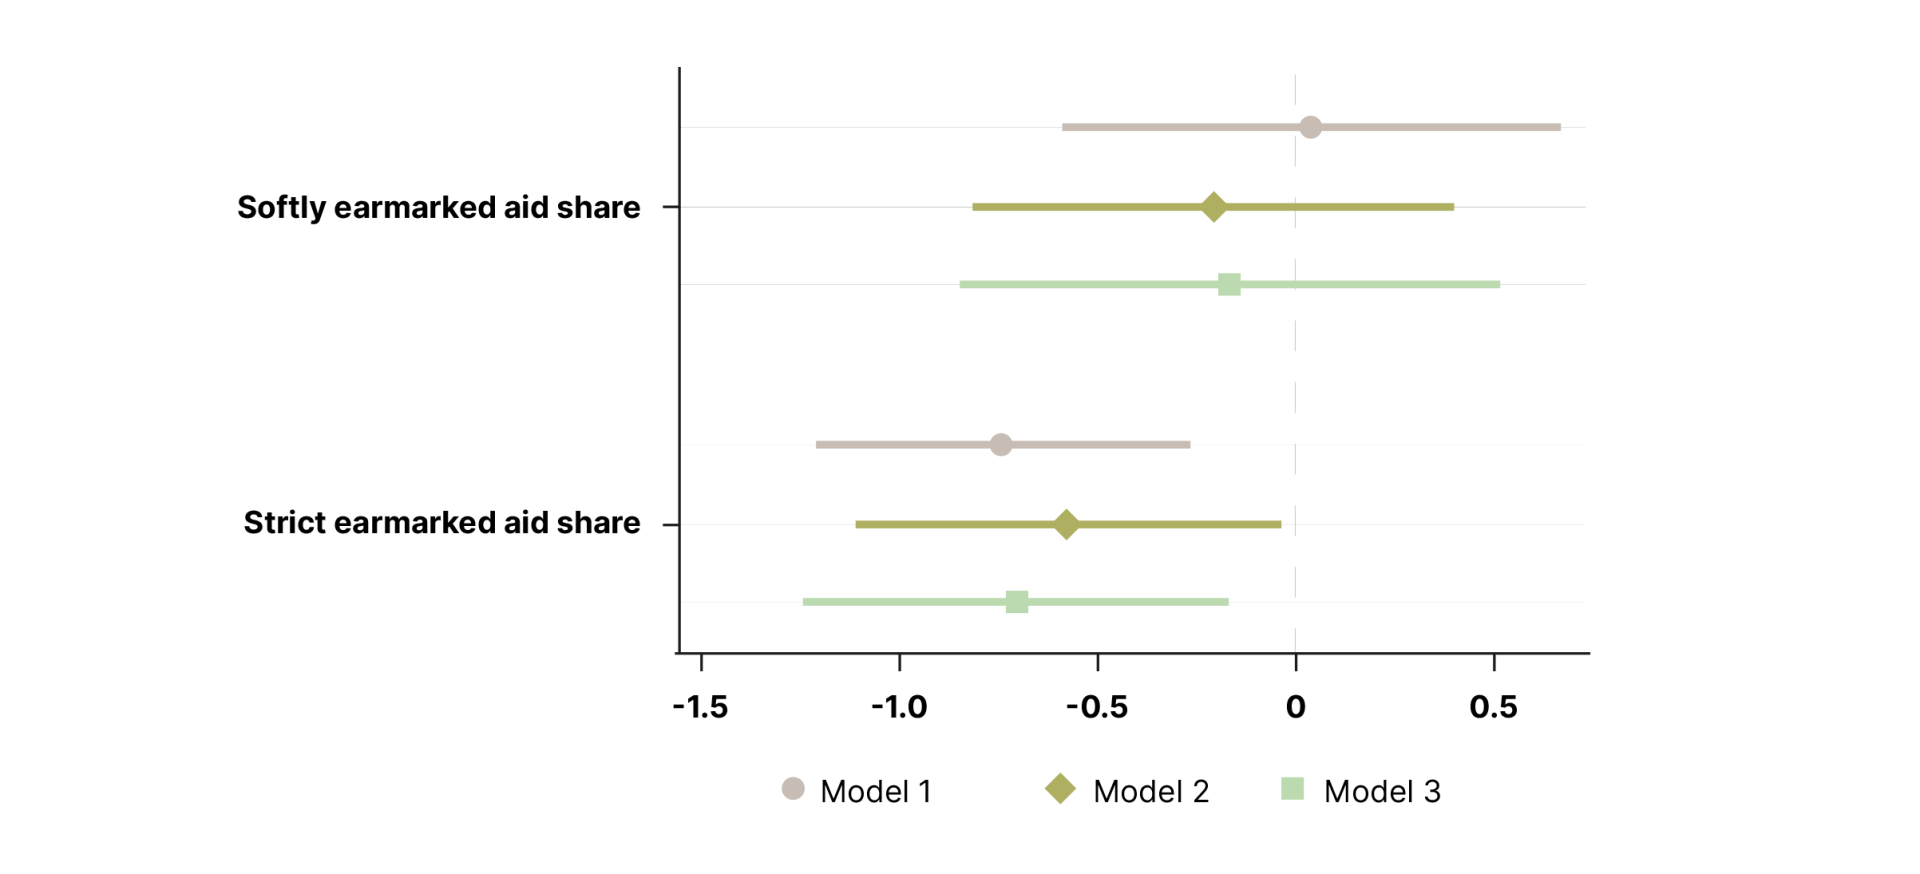
Figure 3
Alignment scores across DAC donors
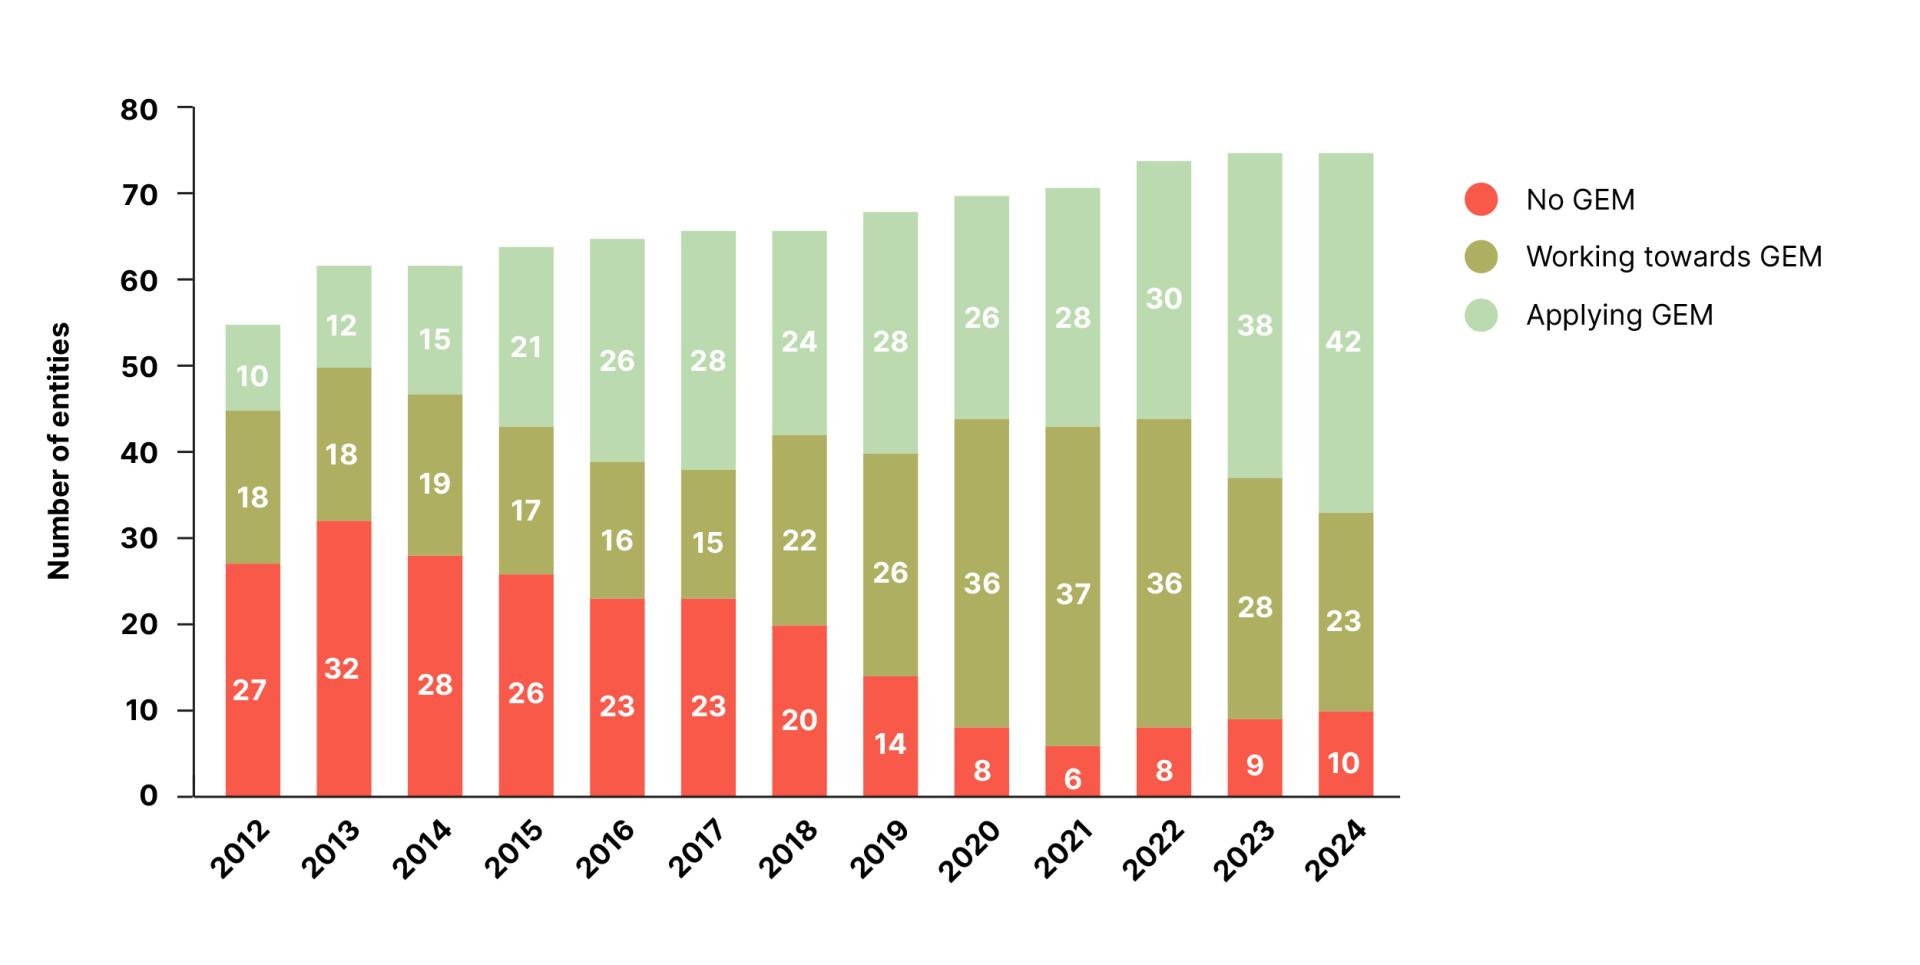
Box 1
GEM Journey (2012-2022)
Figure 3
Total expenses by SDG for 2023
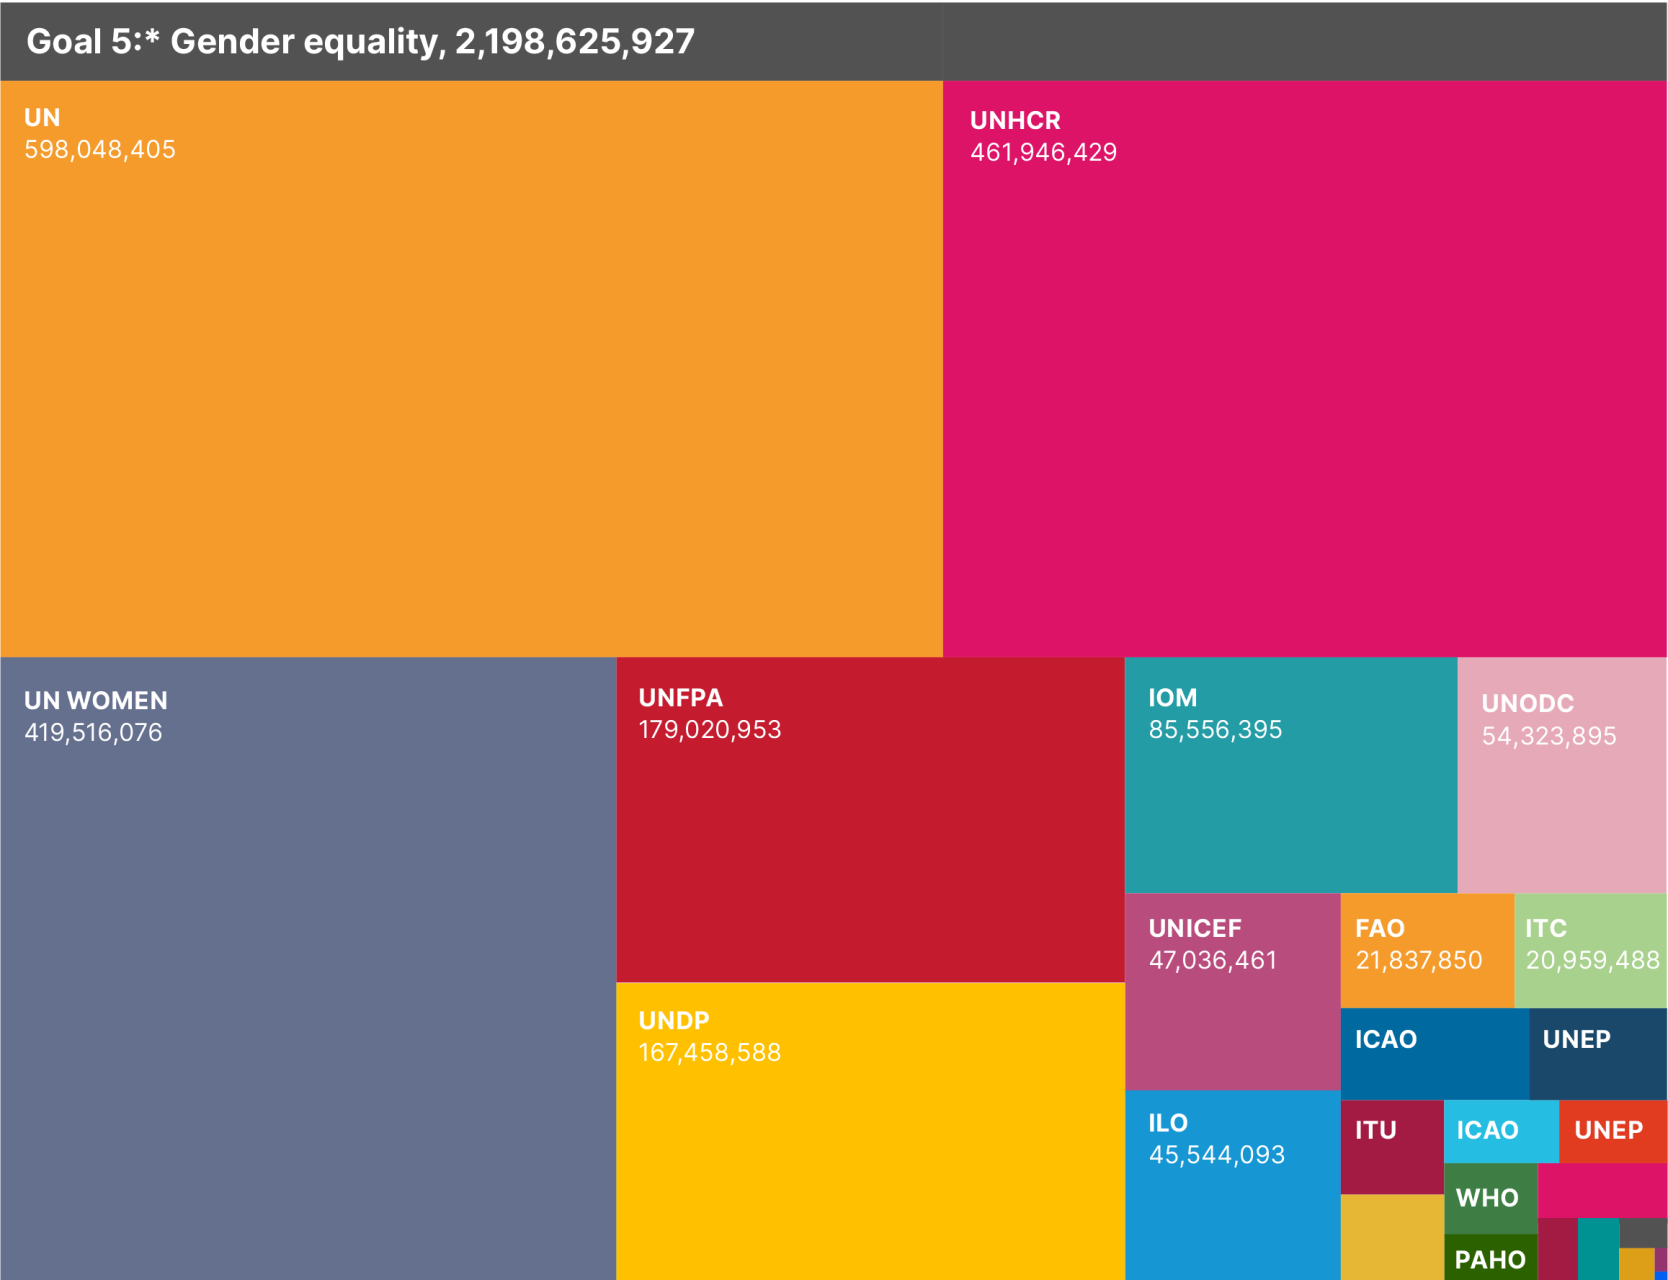
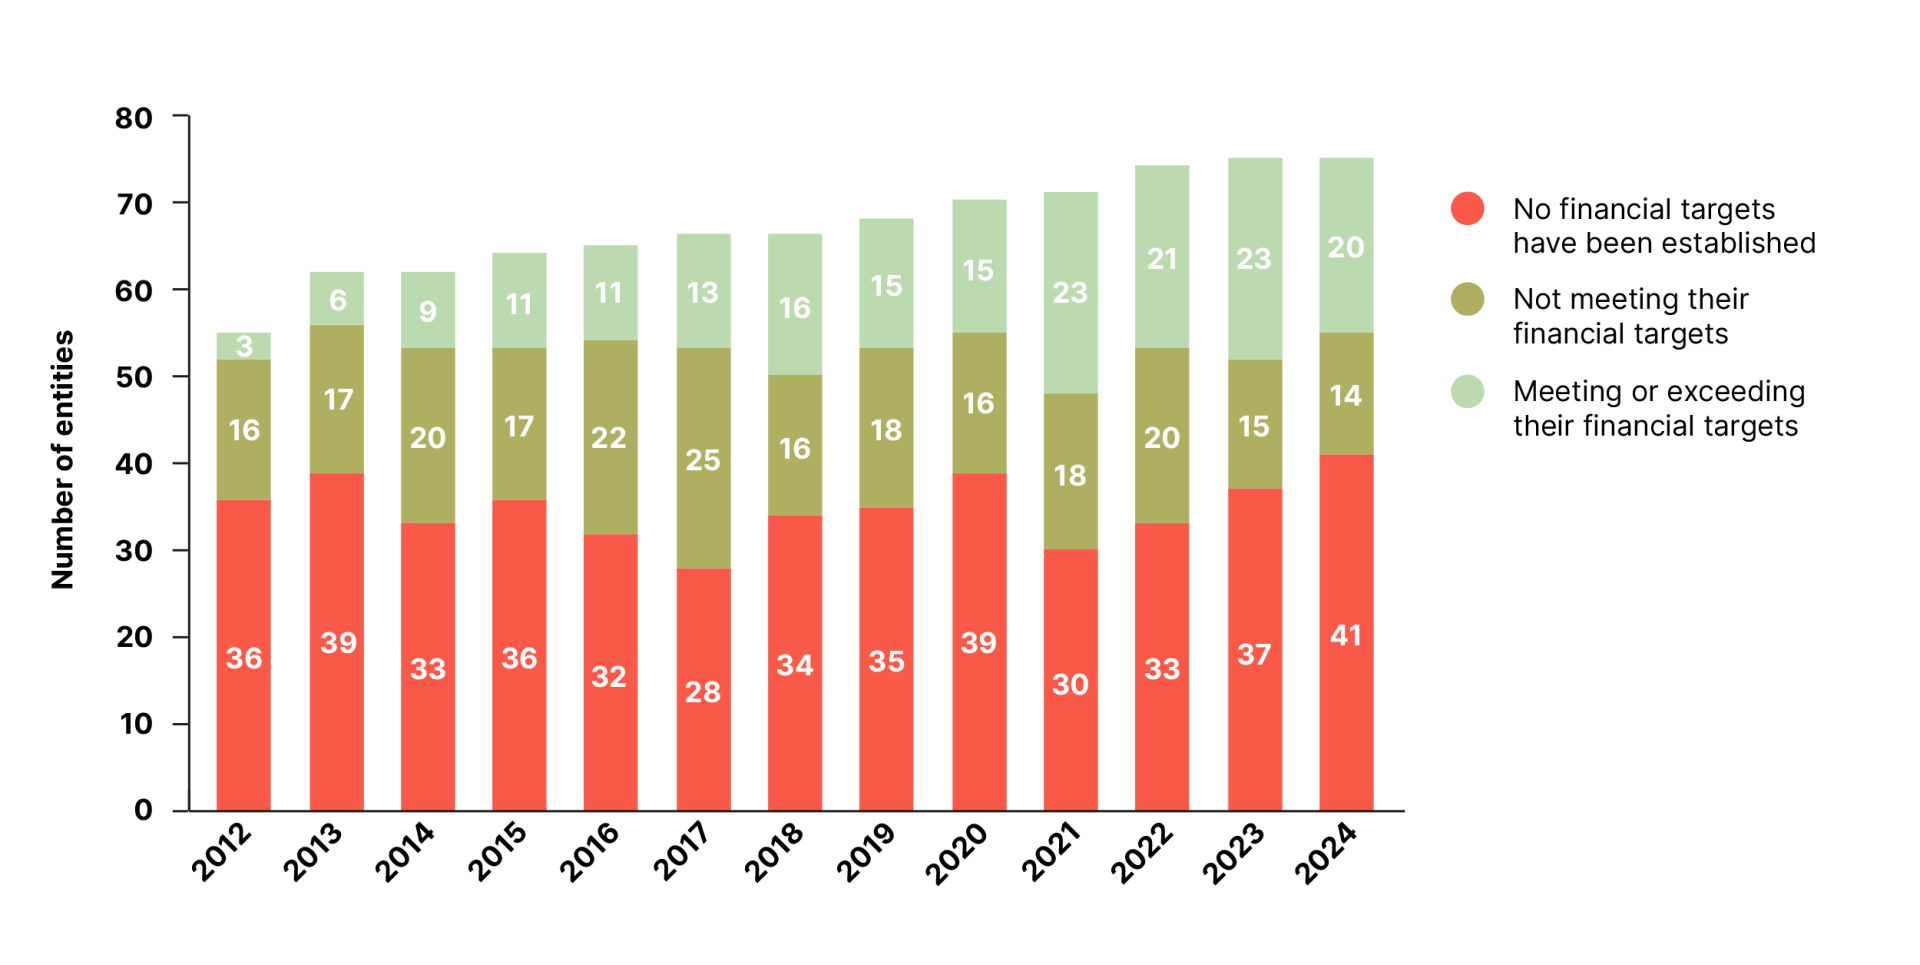
Figure 1
Global school connectivity map
Figure
Key Indicators 2024
Figure 1