In 2023, the UN system’s total expenses reached US$ 68.5 billion, an increase of US$ 1.0 billion – or 1.6%—compared to 2022. This growth mirrors broader trends in UN revenue and represents a 72% increase in expenses since 2010. Nearly three-quarters of this expansion can be attributed to five UN entities: WFP, UNICEF, the UN Secretariat, UNHCR and IOM.
Figure 27 presents the distribution of UN system expenses by function for 2023 (left-hand side), as well as how these shares have evolved annually from 2018 to 2023 (right-hand side). Of the US$ 68.5 billion UN system expenses seen in 2023, the largest portion – 45% – was allocated to humani - tarian assistance (US$ 30.8 billion). Development assis-tance was second with 30% (US$ 20.6 billion), followed by peace operations on 13% (US$ 8.7 billion), and global agenda and specialised assistance on 12% (US$ 8.4 billion).
The bar chart on the right illustrates how the humanitarian assistance share has increased from 36% in 2018 to 45% in 2023, hitting a peak of 46% in 2022. Despite the marginal drop in 2023, this long-term growth highlights the expanding scale and complexity of global humanitarian needs, as well as the UN system’s prominence within the overall humani-tarian response. To put this in perspective, the estimated number of people in need of humanitarian assistance globally rose sharply from 136 million in 2018 to 339 million in 2023.51
Conversely, the peace operations share fell from 19% (US$ 9.9 billion) in 2018 to 13% (US$ 8.7 billion) in 2023, reflecting a relative and absolute reduction arising from mission closures and the restructuring of the UN peace and security pillar.52 Elsewhere, the development assistance share has remained relatively stable, fluctuating between 29% and 33%, while the global agenda and specialised assistance share decreased from 15% in 2018 to 11% in 2021, before increasing to 12% in 2023. In absolute terms, the latter has increased from US$ 8.1 billion in 2018 to $8.4 billion in 2023.53
Expenses of the UN system by function, 2018–2023
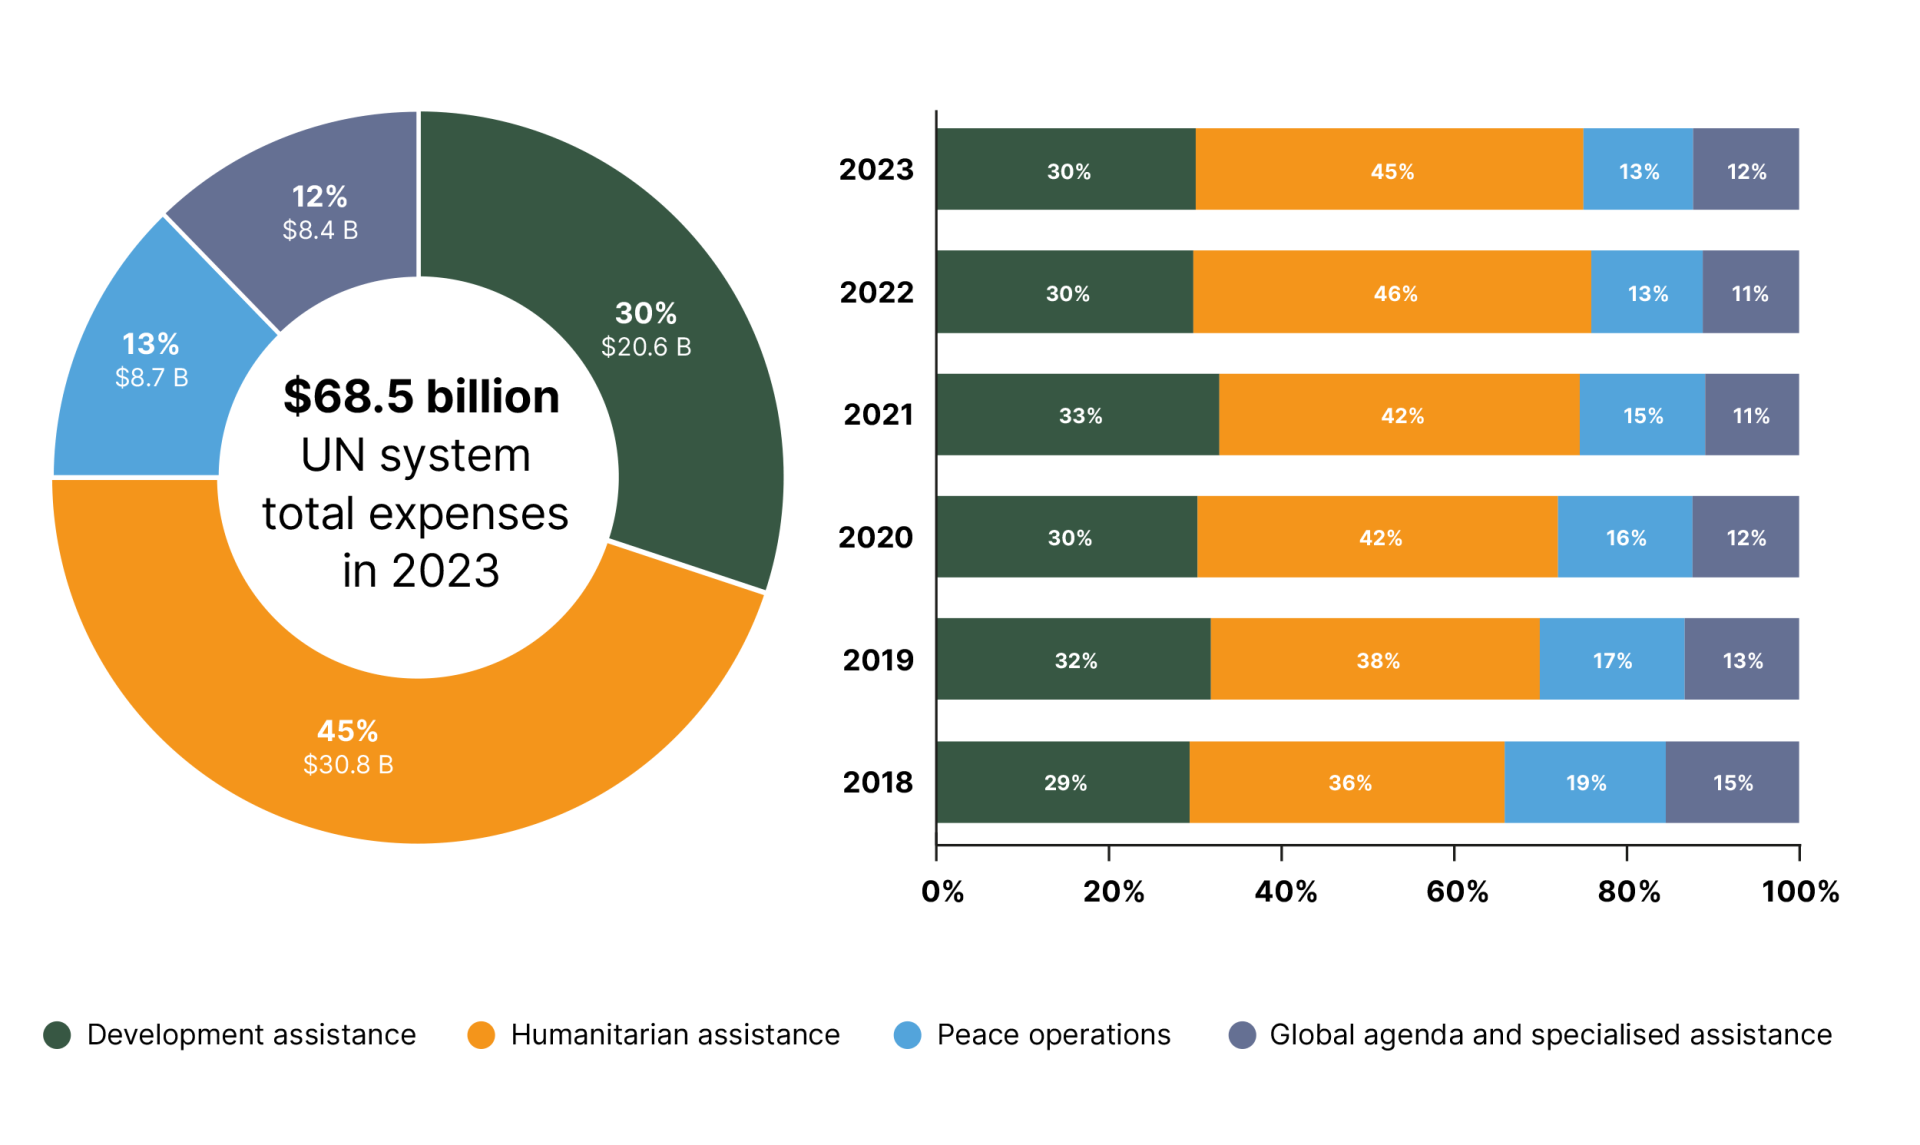
Source: Chief Executives Board for Coordination (CEB).
In 2023, 64% of humanitarian funding reported to the OCHA Financial Tracking Service (FTS) was directly channelled to UN entities, highlighting the UN’s central role in providing urgently needed relief.54 Figure 28 shows total UNDS expenses by function between 2010 and 2023. Whereas humanitarian expenses tripled in size over this period, corresponding to a compound annual growth rate of 10.3%, funding for development assistance – an area where numerous other development partners, including IFIs, are also active – fluctuated between US$ 15 billion and US$ 21 billion, yielding a modest compound annual growth rate of 2.1%.55
In 2023, expenses for UN OAD totalled US$ 51.4 billion, with US$ 20.6 billion directed to development assistance and US$ 30.8 billion to humanitarian assistance. Notably, after more than a decade of year-on-year increases in humanitarian spending, 2023 saw expenses fall by US$ 345 million compared to the US$ 31.1 billion of 2022. This decline appears to reflect a global decline in humanitarian financing between 2022 and 2023, even as worsening violent conflict, climate disasters and economic shocks have dramatically intensified humanitarian needs. For instance, as many as 333 million people are now acutely food insecure, an increase of 184 million compared to pre-COVID-19 pandemic levels.56
Total UN expenses for development and humanitarian assistance, 2010–2023 (US$ billion)
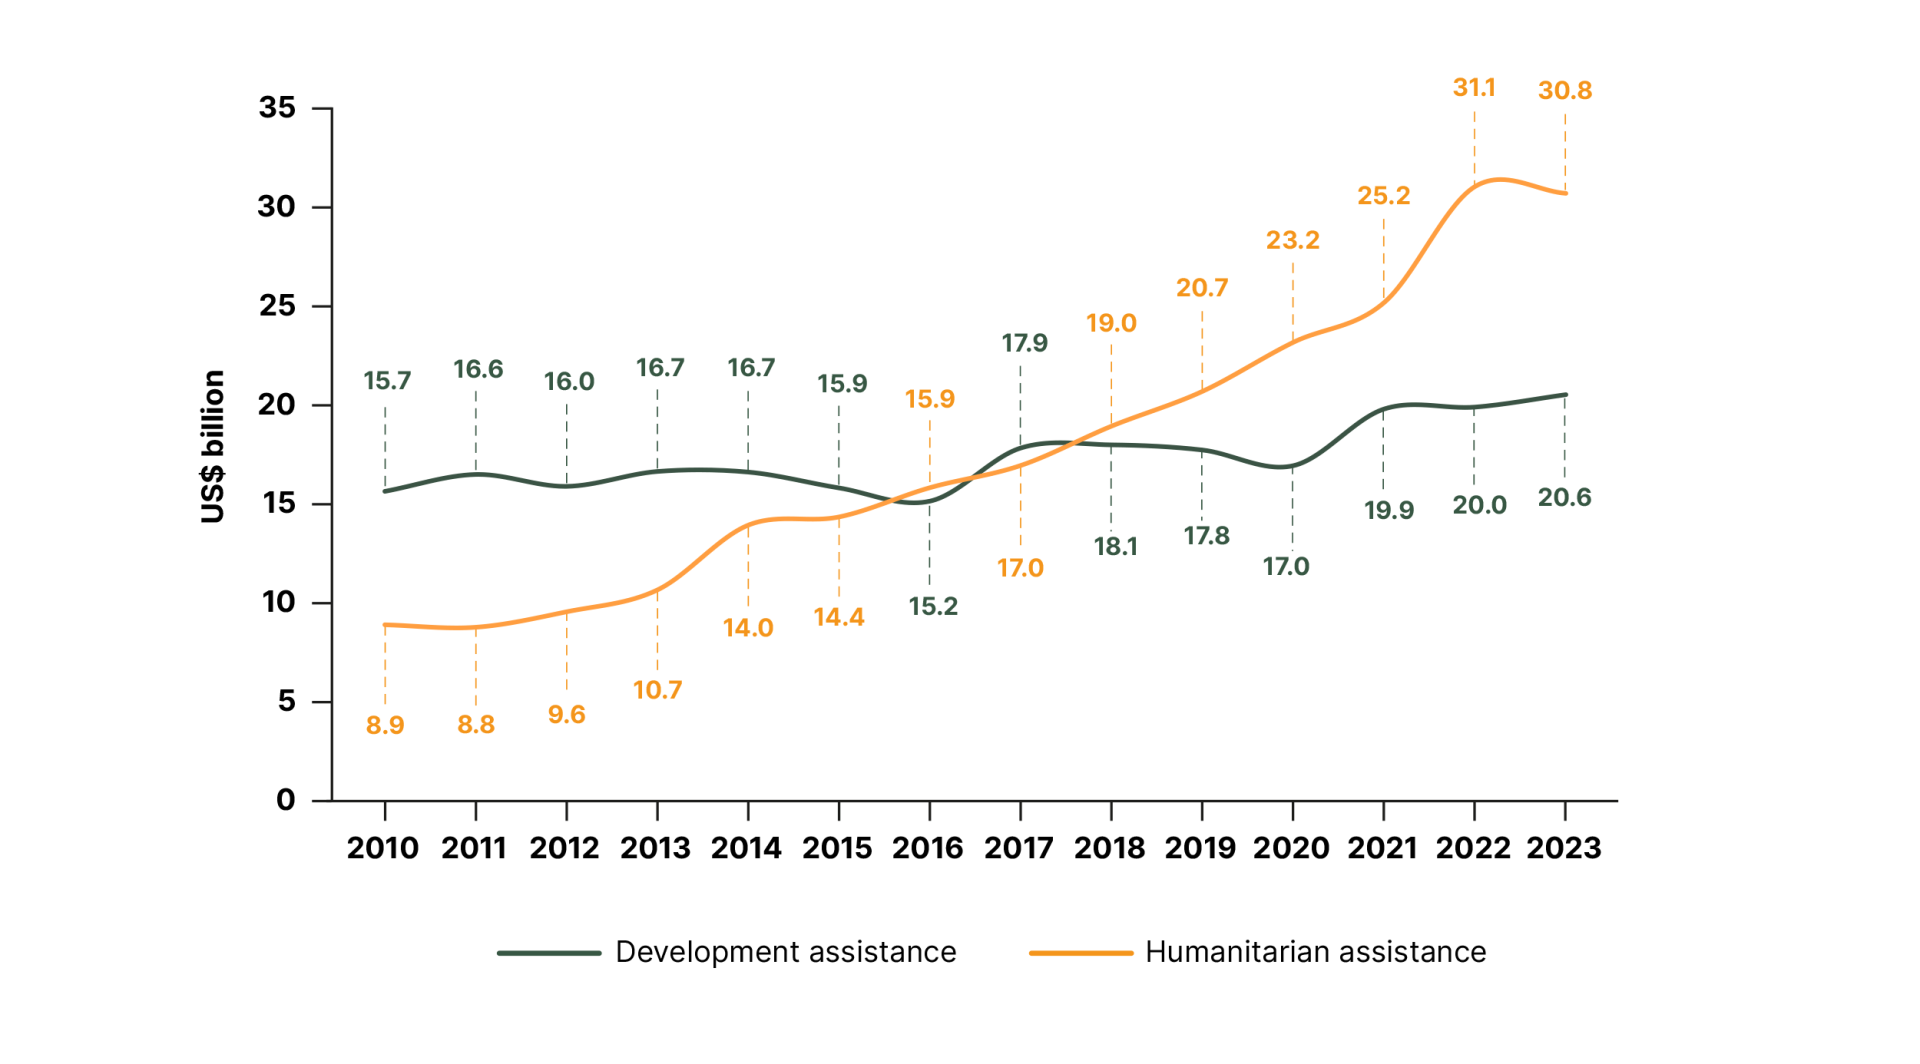
Source: Report of the Secretary-General (A/80/74-E/2025/53). Historical data from various reports.
Note: Data based on information reported to the CEB in accordance with IPSAS and therefore reflects the full value of expenses when they are incurred, not when cash is paid. The 2024 data, submitted through the 2025 CEB reporting exercise, is preliminary.
Despite this backdrop, some donors have cut their humanitarian contributions, while private funding has fallen back from the 2022 peak sparked by the Ukraine response. Preliminary data indicates that only half of global humanitarian requirements in 2024 were funded,57 while there are worrying signs that humanitarian assistance funding will decrease further in 2025.58 This underfunding requires prioritisation of operations, or as UNHCR put it, having ‘to do less with less’.59
Donor budgets have become increasingly stretched at a time when global needs are reaching unprecedented levels. In short, funding has not kept pace with the scale of humanitarian demand. OCHA’s unmet appeal requirements – the gap between identified needs and available resources—reached a record US$ 30.8 billion in 2023: of the US$ 56.1 billion required, only US$ 25.3 billion (45%) was funded.60 Similarly, by the beginning of the fourth quarter of 2023, UNHCR had received only 44% of its US$ 10.9 billion budget (down from 50% at the same point in 2022). As a result, non-essential activities were deferred and per capita funding plummeted to a new low of US$ 47 – 19% below the 10-year average.61