The UN’s central role in responding to the needs of crisis-affected countries means this group accounts for nearly half the UN system’s 2024 annual expenses (48%). Beyond this designation, however, funding levels and modalities vary significantly according to country income level. As such, this section examines the distribution of UN expenses across low-, lower middle-, upper middle- and high-income countries, distinguishing between core and earmarked resources within each group.78 This perspective offers insights into how the UN system balances support for immediate crisis responses with support to countries across diverse economic contexts.
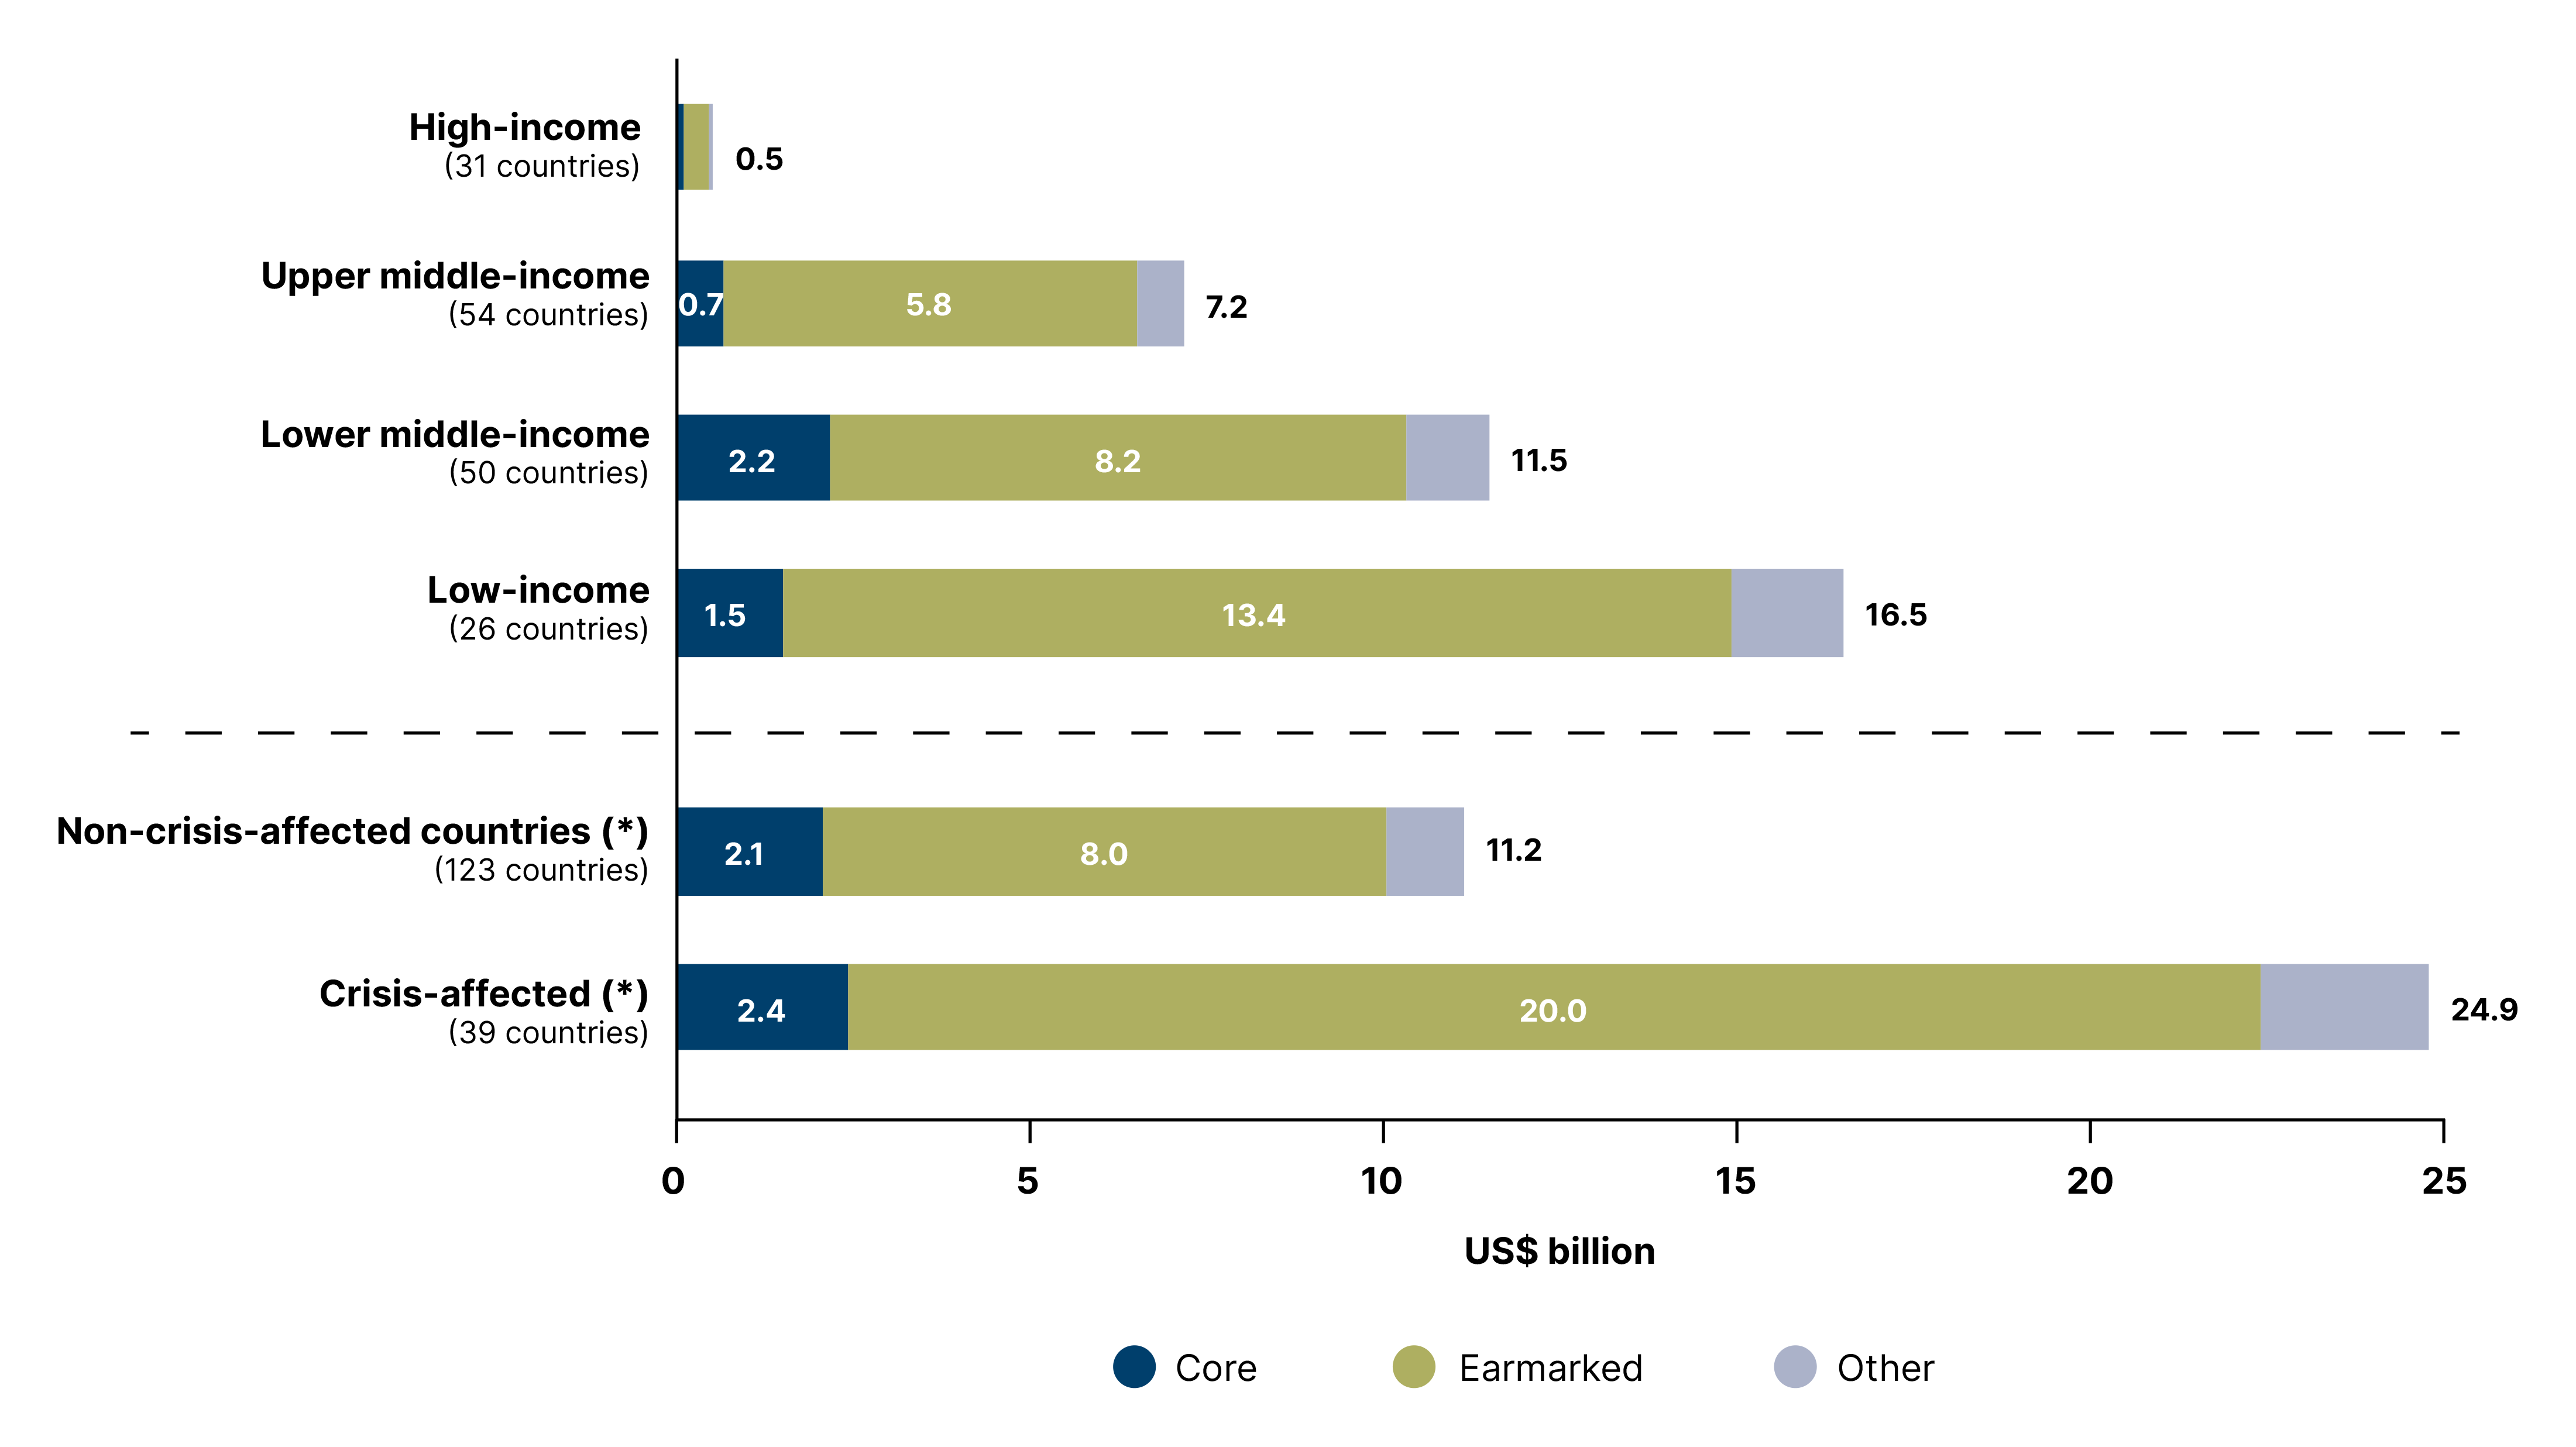
Figure 36 displays UN humanitarian and development expenses according to the income level of UN programme countries, while also distinguishing between crisis-affected and non-crisis-affected contexts.79 It should be noted that the total values differ from those in Figure 34, as Figure 36 limits itself solely to expenses incurred within the 162 UN programming countries (i.e. it excludes global- and regional-level expenses).
UN development and humanitarian expenses in UN programming countries by income status, 2024 (US$ billion)
(*) The non-crisis-affected and crisis-affected UN programming countries are integrated by a variety of income levels Source: Report of the Secretary-General (A/81/75/Add.1-E/2026/61/Add.1) and World Bank.
Note: Venezuela has been temporarily unclassified as of July 2021 pending release of revised national accounts statistics. Thus, expenditure on OAD in Venezuela is only depicted within the crisis-affected countries.
Low-income countries (26) received the highest level of UN expenses in 2024, totalling US$ 16.5 billion; followed by lower middle-income countries (50) with US$ 11.5 billion; upper middle-income countries (54) with US$ 7.2 billion; and lastly high-income countries and territories (31) with just US$ 0.5 billion. Low-income countries had the highest average UN expenses per country and, alongside upper middle-income countries, the greatest reliance on earmarked resources, which accounted for 81% of total expenses in both these income groups.
The 39 crisis-affected countries received a total of US$ 24.8 billion in UN operational activities, equating to 69% of overall country-level spending across the 162 UN programming countries. An overwhelming 81% (US$ 20.0 billion) of this funding was earmarked, dwarfing comparatively modest allocations from core (US$ 2.4 billion) and other resources (US$ 2.4 billion). By contrast, the 123 non-crisis-affected countries received US$ 11.2 billion in total, of which 72% was earmarked, alongside a relatively higher share of core (US$ 2.1 billion) and lower share of other resources (US$ 1.1 billion). In other words, although total funding for the non-crisis-affected group was lower, the structure in place is more conducive to long-term development programming and strategic investment.
The interconnectedness of peace, development and fulfilment of humanitarian needs – highlighted in section 2.3 – is particularly evident when comparing crisis-affected countries with income classifications: more than half the crisis-affected countries are also classified as low-income. Moreover, while downward reclassifications in the World Bank income classifications are infrequent, when they do occur it tends to be in the context of severe economic or political shocks. In July 2023, the State of Palestine ascended to the upper middle-income category based on its 2022 income level, only to drop back down to lower middle-income status a year later. Here, despite the impact of the Gaza war being limited to the fourth quarter of 2023, the 9.2% drop in nominal GDP was sufficient to warrant the downgrading.80