Having reviewed the historical trends in UN system funding, we now turn to 2023 UN system revenue. Figure 4 illustrates how the US$ 67.6 billion in revenue was distributed among the four financing instrument types. Earmarked contributions enjoyed the largest share, with over 60% of total revenue (US$ 41.0 billion), while core resources accounted for 29% of total revenue, comprising US$ 13.8 billion in assessed contributions and US$ 5.7 billion in voluntary core contributions. Finally, revenue from other activities reached an all-time high of US$ 7.0 billion, mainly due to an US$ 1.8 billion increase in revenue earned directly by UN entities, including from investments and exchange rates.
Funding of the UN system by financing instrument, 2023 (US$ billion)
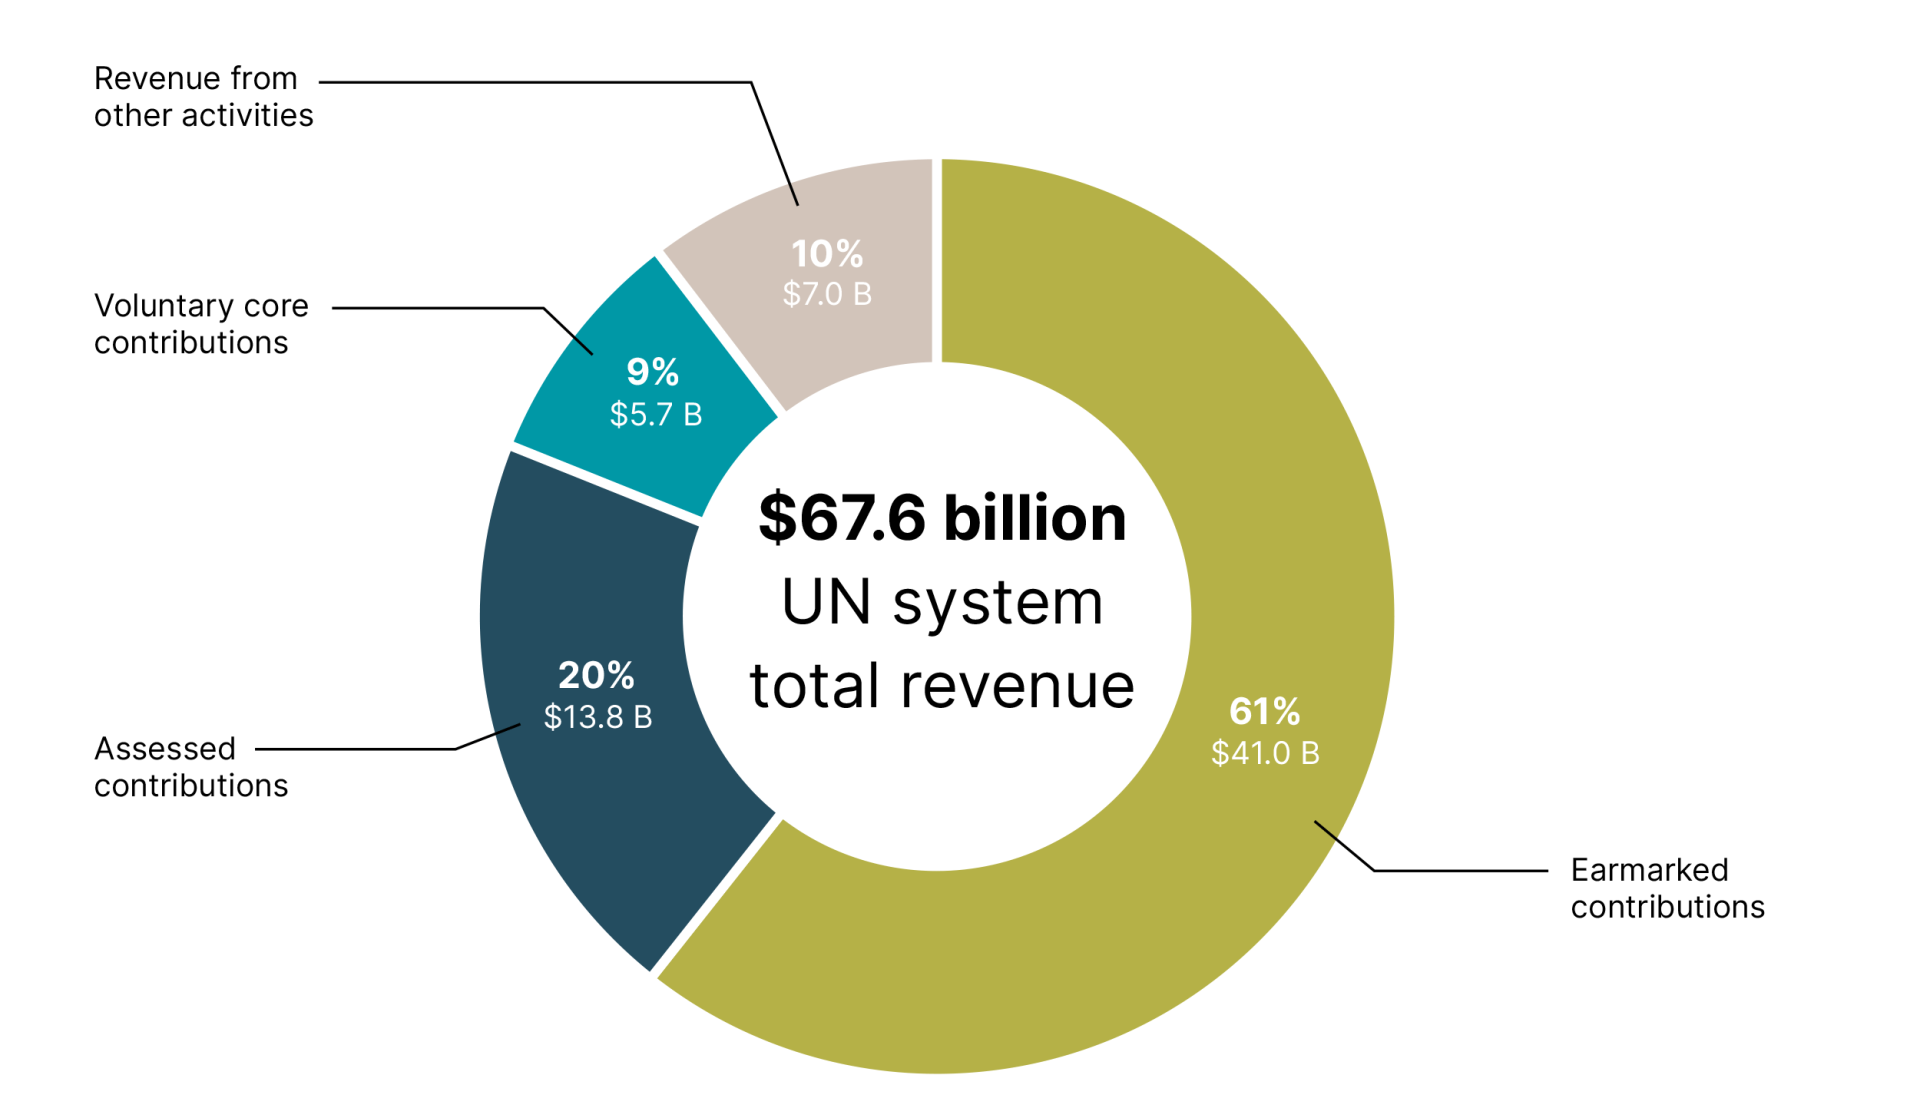
Source: Chief Executives Board for Coordination (CEB).
Table 1 presents a breakdown of 2023 revenue by reporting entity and financing instrument, accompanied by sparklines showing the evolution of each entity’s total revenue since 2010 (or, where applicable, the year an entity began reporting to the CEB). The five UN entities with the highest revenue in 2023 were, respectively, the World Food Programme (WFP), the UN Children’s Fund (UNICEF), the UN Secretariat, the UN Department of Peace Operations
(UN-DPO) and the UN Development Programme (UNDP). The table also points to the diversity of funding models across the UN system, with different entities relying on different combinations of the four financial instruments. For example, UN-DPO is primarily funded through assessed contributions, whereas WFP, UNICEF and UNDP rely largely on earmarked contributions.
Assessed contributions
Assessed contributions are mandatory financial commit-ments assumed by Member States upon joining a UN entity, as defined by treaty obligations.8 These contributions are calculated using a methodology agreed upon by all Member States of a given UN entity. In the case of the UN Secretariat’s regular budget, for example, the scale reflects a country’s capacity to pay, based mainly on its share of global gross national income (GNI), with adjustments made for factors such as debt burden and per capita income. In order to ensure fairness, defined floors and ceilings set out minimum and maximum rates. Despite being reviewed every three years, significant adjustments in the scale of assessments are rare, while interim revisions are only made in the case of a substantial change in a Member State’s relative capacity to pay.
A key advantage of assessed contributions is that they provide predictable, sustainable, flexible funding for the UN system, enabling organisational coherence, strategic planning and support for system-wide functions. In addition, they reinforce the UN system’s multilateral character and impartiality, ensuring baseline funding for essential operations and allowing core functions to be carried out independently of donor preferences.
Table 2 provides an overview of assessed contributions to the UN system by entity, highlighting absolute volumes for 2022 and 2023, as well as the share of assessed contributions within each entity’s 2023 revenue. These figures are accompanied by sparklines illustrating the evolution of assessed funding since 2010 (or the year the entity began reporting to the CEB).
In 2023, total assessed contributions to the UN system amounted to US$ 13.8 billion, reflecting a modest increase of US$ 474 million compared to 2022. This growth was partially due to the payment of outstanding arrears. Assessed contributions remain a critical source of funding for several UN entities, with UN-DPO receiving the largest volume in 2023: US$ 6.5 billion, representing 93% of the entity’s total revenue. Four other UN entities also received over 85% of their funding from assessed contributions in 2023: the Comprehensive Nuclear-Test-Ban Treaty Organization (CTBTO), the International Criminal Court (ICC), the International Residual Mechanism for Criminal Tribunals (IRMCT), and the World Trade Organization (WTO). As entities tasked with upholding international legal and normative frameworks, they benefit from stable, predictable, impartial funding that can ensure continuity of operations and safeguard their independence. The UN Secretariat, meanwhile, received US$ 3.3 billion, equivalent to 43% of its revenue.
Voluntary core contributions
Voluntary core contributions are untied, unrestricted funding – whether monetary or in-kind – that UN entities can allocate flexibly in line with their strategic priorities. They are termed ‘voluntary’ because they are provided at the discretion of the contributor, and ‘core’ because they play a crucial role in bridging funding gaps and enabling entities to respond to emergent crises. Unlike assessed contributions, voluntary core funding can be reduced, withheld or suspended at any time, which poses challenges for planning. In contrast to earmarked funding, and similar to assessed contributions from the perspective of the intended objective, voluntary core contributions are not linked to specific projects, outcomes or locations. This makes them especially valuable for supporting normative work, as well as strengthening institutional capacity and system-wide coherence.
In 2023, voluntary core contributions across the UN system amounted to US$ 5.7 billion, or 9% of the US$ 67.6 billion in overall revenue (see also Figure 4 on page 40 and Table 1 on page 41). Two UN entities – Unitaid and the Joint United Nations Programme on HIV and AIDS (UNAIDS) – stand out for the high proportion of voluntary contributions within their overall funding, at 70% and 69% respectively.9 This heavy reliance on voluntary contributions underscores the degree to which their roles in the global health architecture depend on a sustained commitment to voluntary funding.
As in previous years, a small number of UN entities received the lion’s share of voluntary core contributions in absolute terms, reflecting both their institutional mandates and donor priorities. UNICEF received the highest volume of voluntary core funding at US$ 1.4 billion – a number that includes contributions from governments, as well as unearmarked funds provided by UNICEF National Committees.10 The UN Relief and Works Agency for Palestine Refugees in the Near East (UNRWA) followed with US$ 717.6 million,11 while WFP received US$ 623.6 million, including funds to the Immediate Response Account (IRA). These flexible funds enabled WFP to respond to multiple, simultaneous hunger crises by realigning its operations to address emerging needs.12
The volatility in voluntary contribution volume can partly be attributed to the fact that when reporting their audited financial statements and financial data to the CEB, UN entities must recognise revenue on an accrual basis, in accordance with the International Public Sector Accounting Standards (IPSAS). Thus, the full value of unconditional multi-year contribution arrangements must be recognised upon signature. Here, it should be noted that some UN entities recognise revenue on a cash basis in management publications, such as the funding compendiums (for further details, see Box 1 on page 92).
Earmarked contributions and degrees of earmarking
Earmarked funding is also provided at the discretion of the contributor. Such resources are, however, designated for specific initiatives or projects, often guided by donor preferences regarding location, thematic focus or expected outcomes. As shown in figures 1 and 2, these contributions have been the primary driver of the overall growth in UN system funding, doubling from US$ 20.3 billion in 2010 to US$ 41.0 billion in 2023. This trend reflects a broader shift in donor preferences towards contributions being more visible and subject to greater direction. As discussed in section 1.1, earmarked contributions to the UN system declined by US$ 8.6 billion in 2023 compared to 2022, but were never-theless US$ 1 billion higher than in 2021. These fluctuations underscore the volatile nature of this funding stream.
Table 3 presents an overview of earmarked contributions to the UN system by entity, showing the absolute amounts for 2022 and 2023, the share of earmarked funding within each entity’s total 2023 revenue, and sparklines illustrating the evolution of this funding since 2010 (or since the year the entity began reporting to the CEB).
More than three-quarters of the funding received by 12 of the UN entities depicted in Table 3 was earmarked. The International Organization for Migration (IOM), the United Nations Institute for Training and Research (UNITAR), and the United Nations Capital Development Fund (UNCDF) each received 90% or more of their funding in this way. In the case of these three entities, not only do they mainly deliver targeted services or technical assistance at the request of Member States, their work is closely aligned with clearly defined outcomes. For example, as the leading intergovernmental organisation in the field of migration, IOM frequently operates in some of the world’s most complex emergency settings, prompting donors to earmark contributions for specific countries, migration flows or emergency humanitarian responses.
Despite a 40% decline in earmarked contributions – from US$ 13.7 billion in 2022 to US$ 8.2 billion in 2023 – WFP remained the largest recipient of earmarked resources in absolute terms. In 2023, 89% of WFP’s total revenue was tied to specific purposes, underscoring the entity’s central role in emergency and humanitarian response, with funding often tightly linked to specific crises or geographic priorities. UNICEF received the second-highest volume of earmarked funding, with contributions ranging from tightly earmarked resources to those earmarked with a greater degree of flexibility, to softly earmarked pooled or thematic funds. Notably, 53% of UNICEF earmarked funding in 2023 was allocated to 15 countries.13
Earmarked contributions to the UN system by type, 2018–2023 (percentage share of total earmarked contributions)
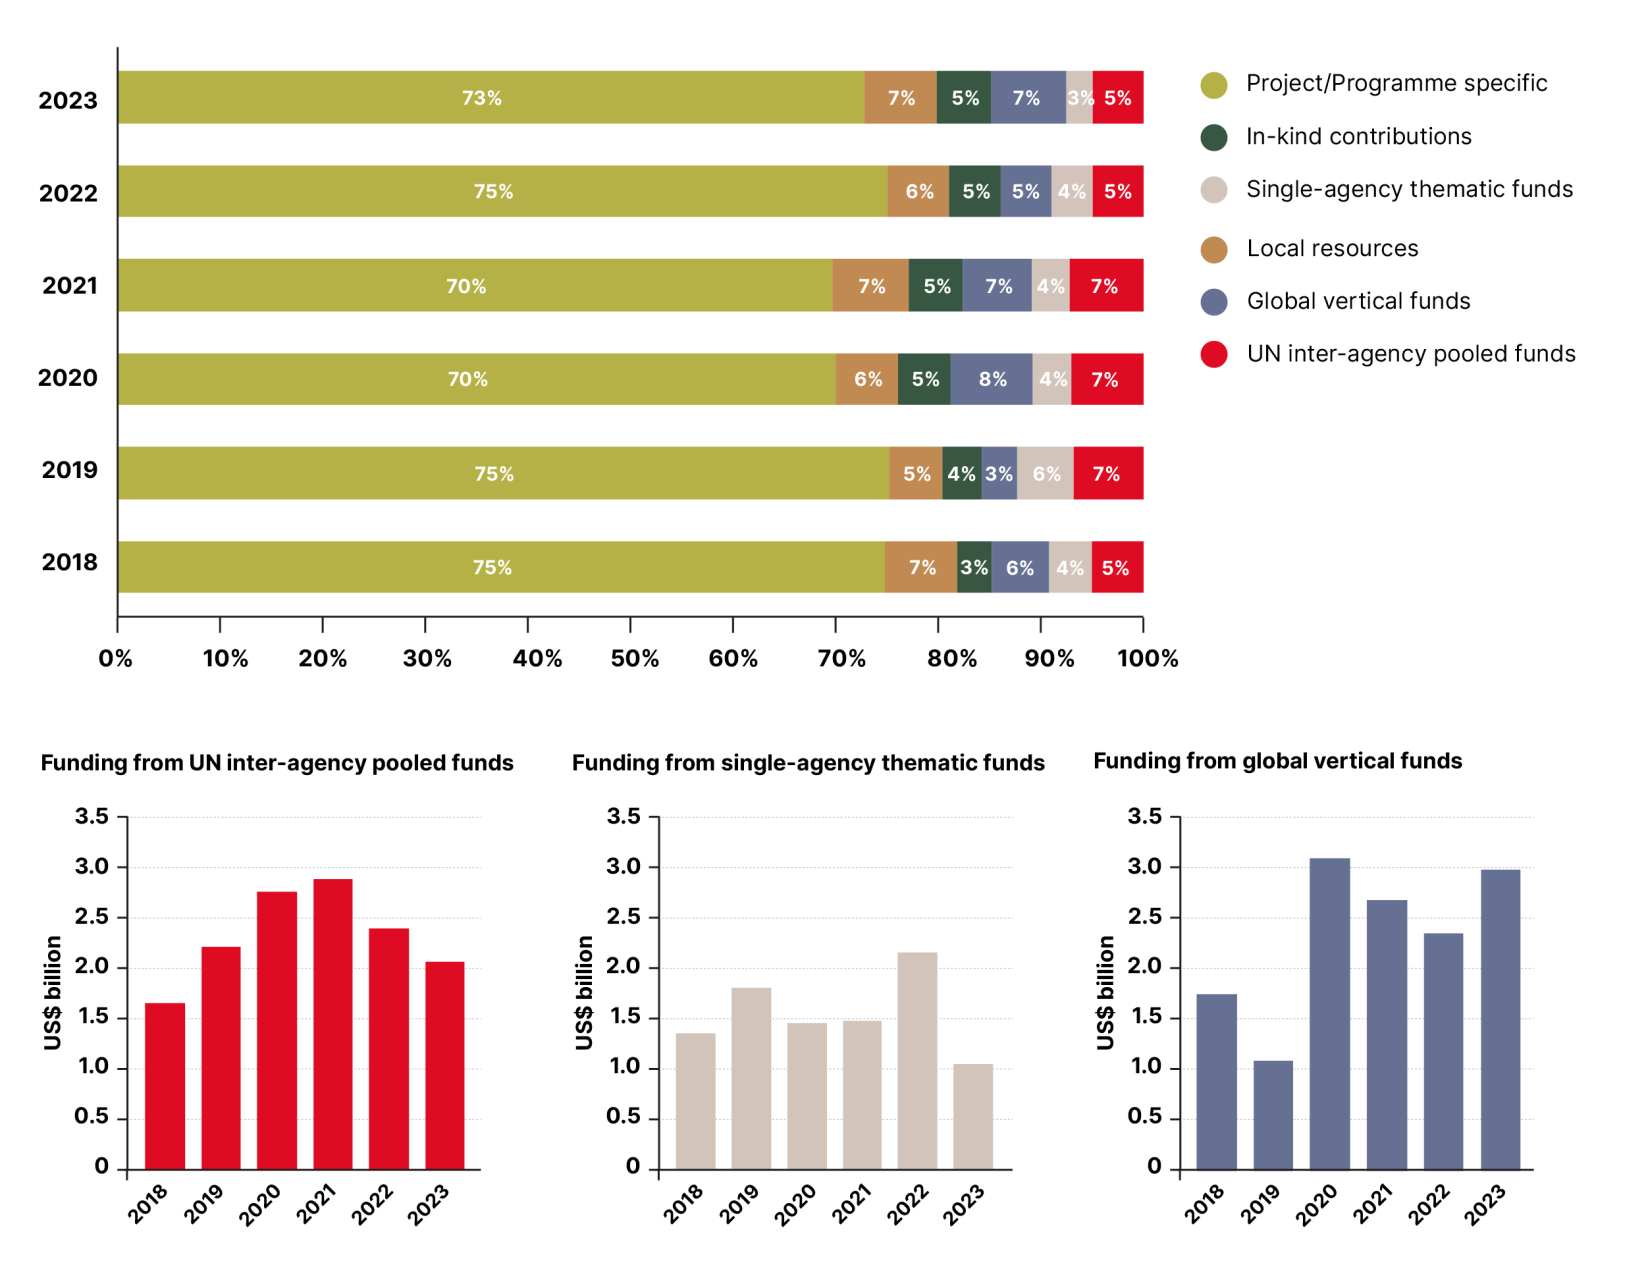
Source: Chief Executives Board for Coordination (CEB).
Note: Percentages represent the share of total earmarked contributions for the respective year.
As the dominant form of financing across much of the UN system, earmarked funding has played a crucial role in responding to recent crises. While this modality enhances resource availability and donor visibility, it raises concerns about financial vulnerability and reporting burdens, as earmarked contributions tend to be less predictable, more volatile and more transaction-intensive than core funding.14
In response to these challenges, joint commitments between Member States and UN entities, such as the Grand Bargain (focused on humanitarian assistance) and the Funding Compact (focused on development assistance), have sought to promote a more balanced, sustainable financing approach. Under these frameworks, UN entities have pledged to improve operational effectiveness, transparency and accou nt ability beyond short-term measures. At the same time, donors have committed to increasing funding flexibility and supporting a more equitable distribution between earmarked, softly earmarked and core resources.
Regardless of whether contributions are directed towards a specific entity or an inter-agency pooled fund, or whether they support a particular country, group of countries or thematic area, there remains scope for making them as flexible as possible when advancing a particular plan or programme.15 Earmarked contributions can vary significantly in terms of flexibility, impact and the ability to support coordinated approaches. The horizontal bars in Figure 5 show the percentage breakdown of contributions by ear-marked type from 2018 to 2023. Each category offers a different degree of flexibility, ranging from the more tightly earmarked in the left-hand side to the more flexible modalities on the right. Definitions and characteristics of these earmarked funding types are provided in Box 3 on page 95.
Despite the commitments made in the 2019 Funding Compact, the figures show a persistent imbalance in the earmarked funding landscape between 2018 and 2023. Project- or programme-specific contributions dominated over the period, accounting for 70% or more of earmarked funding each year. By contrast, thematic and pooled funding modalities remained in single digits. UN inter-agency pooled funding is a trusted instrument that provides flexible, predictable resources; leverages new funding sources; promotes coherence; and strengthens collaboration. Despite being a key component of the UN funding landscape, however, it accounted for only a modest share of the earmarked portfolio during the period, fluctuating between 5% and 7%.16 The new 2024 Funding Compact calls for 30% of earmarked Member State contributions for development activities to be channelled through UN inter-agency pooled funds by 2027.
The column figures in Figure 5 show the volume of earmarked resources UN system entities have received through, respectively, inter-agency pooled funds , single-agency thematic funds and global vertical funds from 2018 to 2023. The average annual revenue from global vertical funds nearly doubled in the period 2020–2023 (US$ 2.8 billion) compared to the 2018–2019 average (US$ 1.4 billion), reflecting a sustained increase in this funding modality’s use within the UN system.17 In 2023, three entities
– UNDP, UNICEF and the World Health Organization (WHO)
– accounted for 79% of the UN system’s total revenue from global vertical funds. Adding the Food and Agriculture Organization (FAO) into these calculations increases the proportion to 85%.
Revenue from other activities
The remaining revenue streams are grouped under the ‘reve nue from other activities’ category. This encompasses income received by UN entities that cannot be classified as a ‘contribution’ under their accounting policies and is reported across three types: 1) other revenue – specific to the UN entity; 2) other revenue – other UN entities; and 3) other revenue – external to the UN. The first category consists of financial gains resulting from investments, exchange rate fluctuations, and proceeds from the transfer of property, plants or equipment. The second and third categories capture, respectively, revenue earned from services provided on behalf of other UN entities or external parties, such as governments or organisations outside the UN system.18
In 2023, total revenue from other activities amounted to US$ 7.0 billion, representing 10% of total UN system revenue – a US$ 1.8 billion increase on the US$ 5.2 billion received in 2022 (see also Figure 2). Three UN entities received 70% or more of their funding from this financial instrument: the Office for Project Services (UNOPS), the World Intellectual Property Organization (WIPO) and the Pan American Health Organization (PAHO). These entities are notable within the UN system for being (almost) entirely self-financed.
UNOPS generated its entire reported income (US$ 1.3 billion) from providing infrastructure, procurement and project management services to UN entities and other stake-holders, while WIPO received 95% of its total income from fee-based services offered to users of global intellectual property systems.19 PAHO, for its part, obtained 70% of its revenue by providing procurement services for vaccines and public health supplies.
Preliminary 2024 revenue data
The ongoing shifts in the international funding landscape have led to persistent revenue constraints for UN entities since 2023. Figure 6 presents the annual nominal revenue of selected UN entities from 2015 to 2024. It is the only figure in Chapter 1 that includes preliminary 2024 revenue data, which was subject to verification at the time this report was prepared.
On average, the total revenue of the ten selected entities grew at a compound annual growth rate of 3.8% over a nine-year period, increasing from US$ 39.0 billion in 2015 to US$ 54.4 billion in 2024. Between 2023 and 2024, total revenue across these entities increased marginally by US$ 217 million, or 0.4%. While the aggregate trend points to modest growth, only half reported an increase in revenue. The largest absolute increase was observed in the WFP, whose funding rose by over US$ 1.2 billion and accounted for most of the net growth among the group. Other entities with rising revenue include the UN Secretariat, UNHCR, IOM and UNFPA, marking a continued prioritization of humanitarian operations.
WFP recorded in 2024 the highest annual growth rate, with a 14% increase. This brought its total revenue to US$ 10.4 billion, representing the second-highest level of funding on record. Of this total, US$ 9.8 billion came from contribution revenue, covering only 54% of WFP’s operational needs which reached US$ 18.2 billion in 2024, as reported in the WFP Annual Performance Report.20 The revenue increase was driven by higher contributions from several donors, most notably the US, which represented 45% of WFP’s total contribution revenue for the year.21
UNDP’s total revenue amounted to US$ 5.3 billion — corresponding to a US$ 640 million decrease from US$ 5.9 billion in 2023. This 11% decline represents a reversal from the previous year, when UNDP’s total revenue had increased by 12%, driven primarily by higher levels of earmarked voluntary contributions.
UN-DPO is the only entity among the ten depicted in Figure 6 that experienced a steady decrease in revenue between 2015 and 2024, at a compound annual decline rate of 2.8%. This reduction is in part attributed to the closure or transitioning of UN peacekeeping missions. By contrast, IOM—which serves as a front-line agency responding to global displacement crises—recorded the highest compound annual growth rate among the entities, with 9.8% over the same period.
Between 2022 and 2023, UNICEF and UNHCR each faced a sharp revenue decline of US$ 1.4 billion in revenue, with no meaningful recovery in 2024. UNHCR recorded a modest increase of US$ 29 million in 2024, while UNICEF faced a further contraction of US$ 321 million. According to its 2024 annual report, anticipated funding cuts led to the scaling-back of programmes in key operations, limiting its ability to reach millions of children in extreme need. Similarly, UNHCR faced significant funding shortfalls; for the first time in 2024, its available funds covered less than half of the needs identified.22
Against this backdrop of growing needs and increasingly constrained resources, several UN entities had to recalibrate their 2024 budgets, adjusting budgeted corporate and operational activities and making difficult trade-offs.
Total revenue of select UN entities, 2015–2024 (US$ billion)
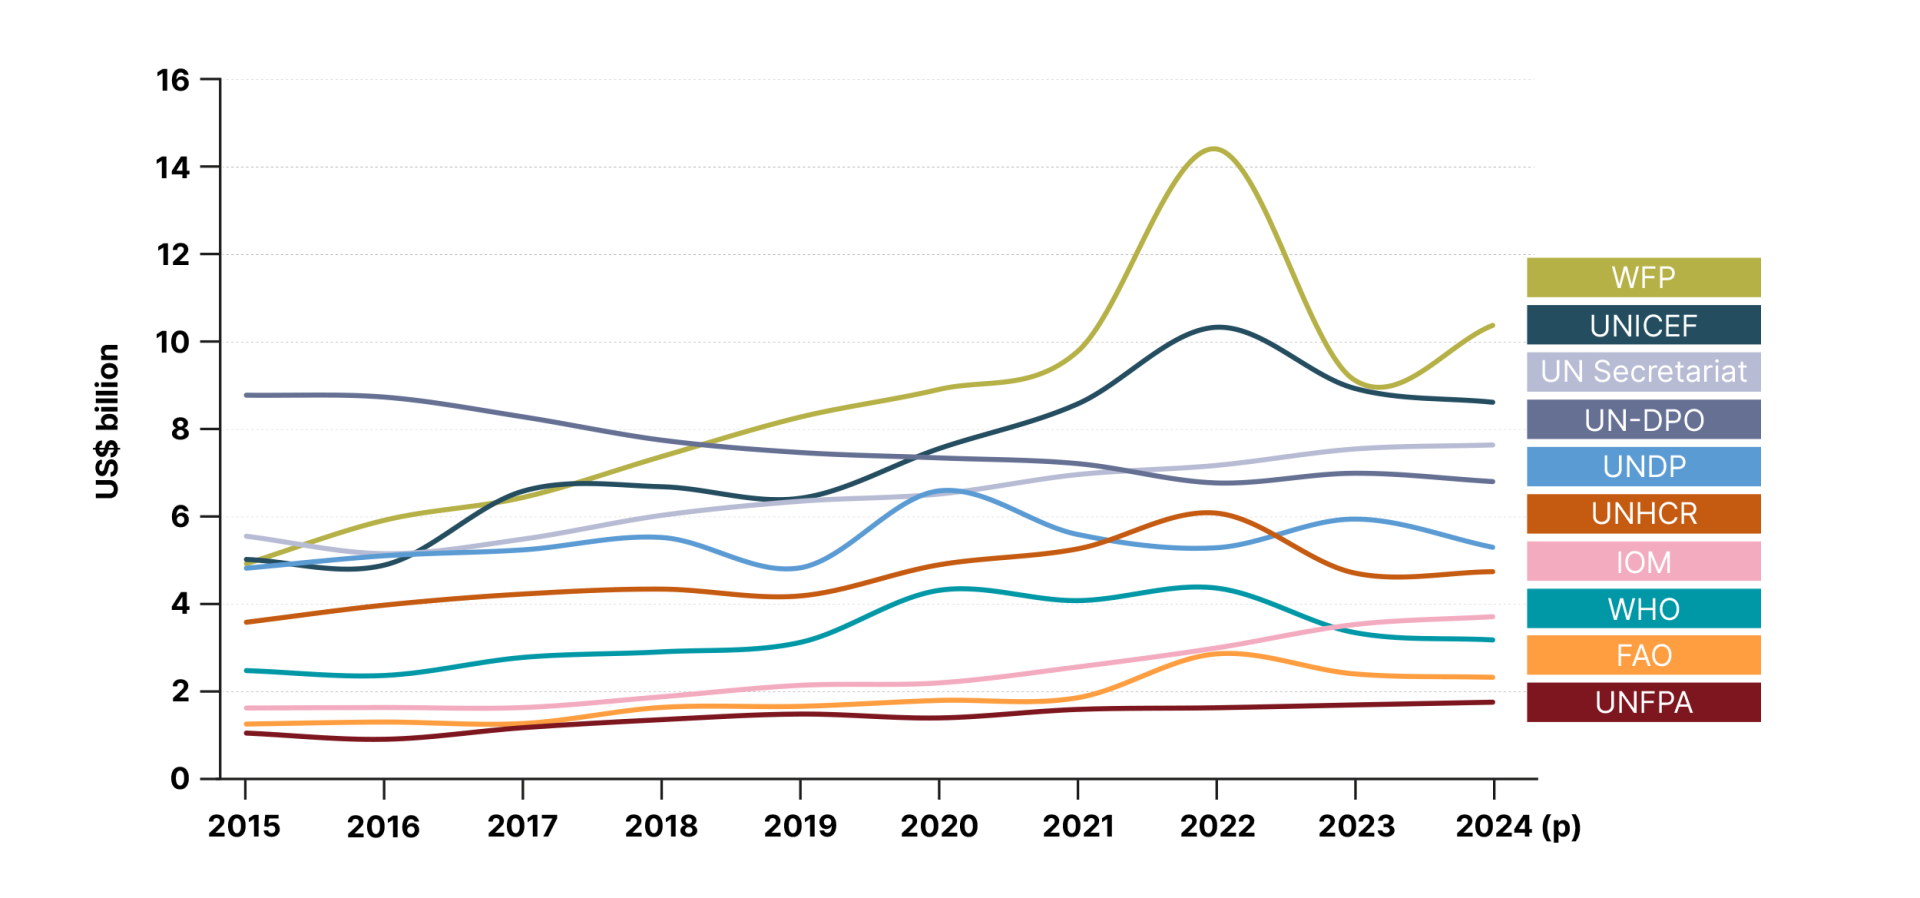
Source: Chief Executives Board for Coordination (CEB).
Note: Data based on information reported to the CEB in accordance with IPSAS and therefore reflects the full value of funding agreements
at the time they are signed. The 2024 data, submitted through the 2025 CEB reporting exercise, is preliminary.