In bringing Chapter 1 to a conclusion, this section expands the perspective by contextualising the UN system within the broader multilateral ecosystem, Figure 24 compares the official development assistance (ODA) provided by OECD-DAC members to various multilateral institutions, including the distribution of funding between core and earmarked funding.
Turning to data from the OECD’s Creditor Reporting System (CRS), it is again apparent that OECD-DAC members earmark a higher proportion of their total funding to the UN system than they do to any other multilateral institution, including the EU, regional banks, the World Bank Group, and the IMF. Earmarked funding to the UN system accounted for 60% of OECD-DAC member funding in 2011, rising to 71% in 2022. By contrast, the corresponding 2022 figure for regional development banks and the other multilateral institutions was approximately 36%.
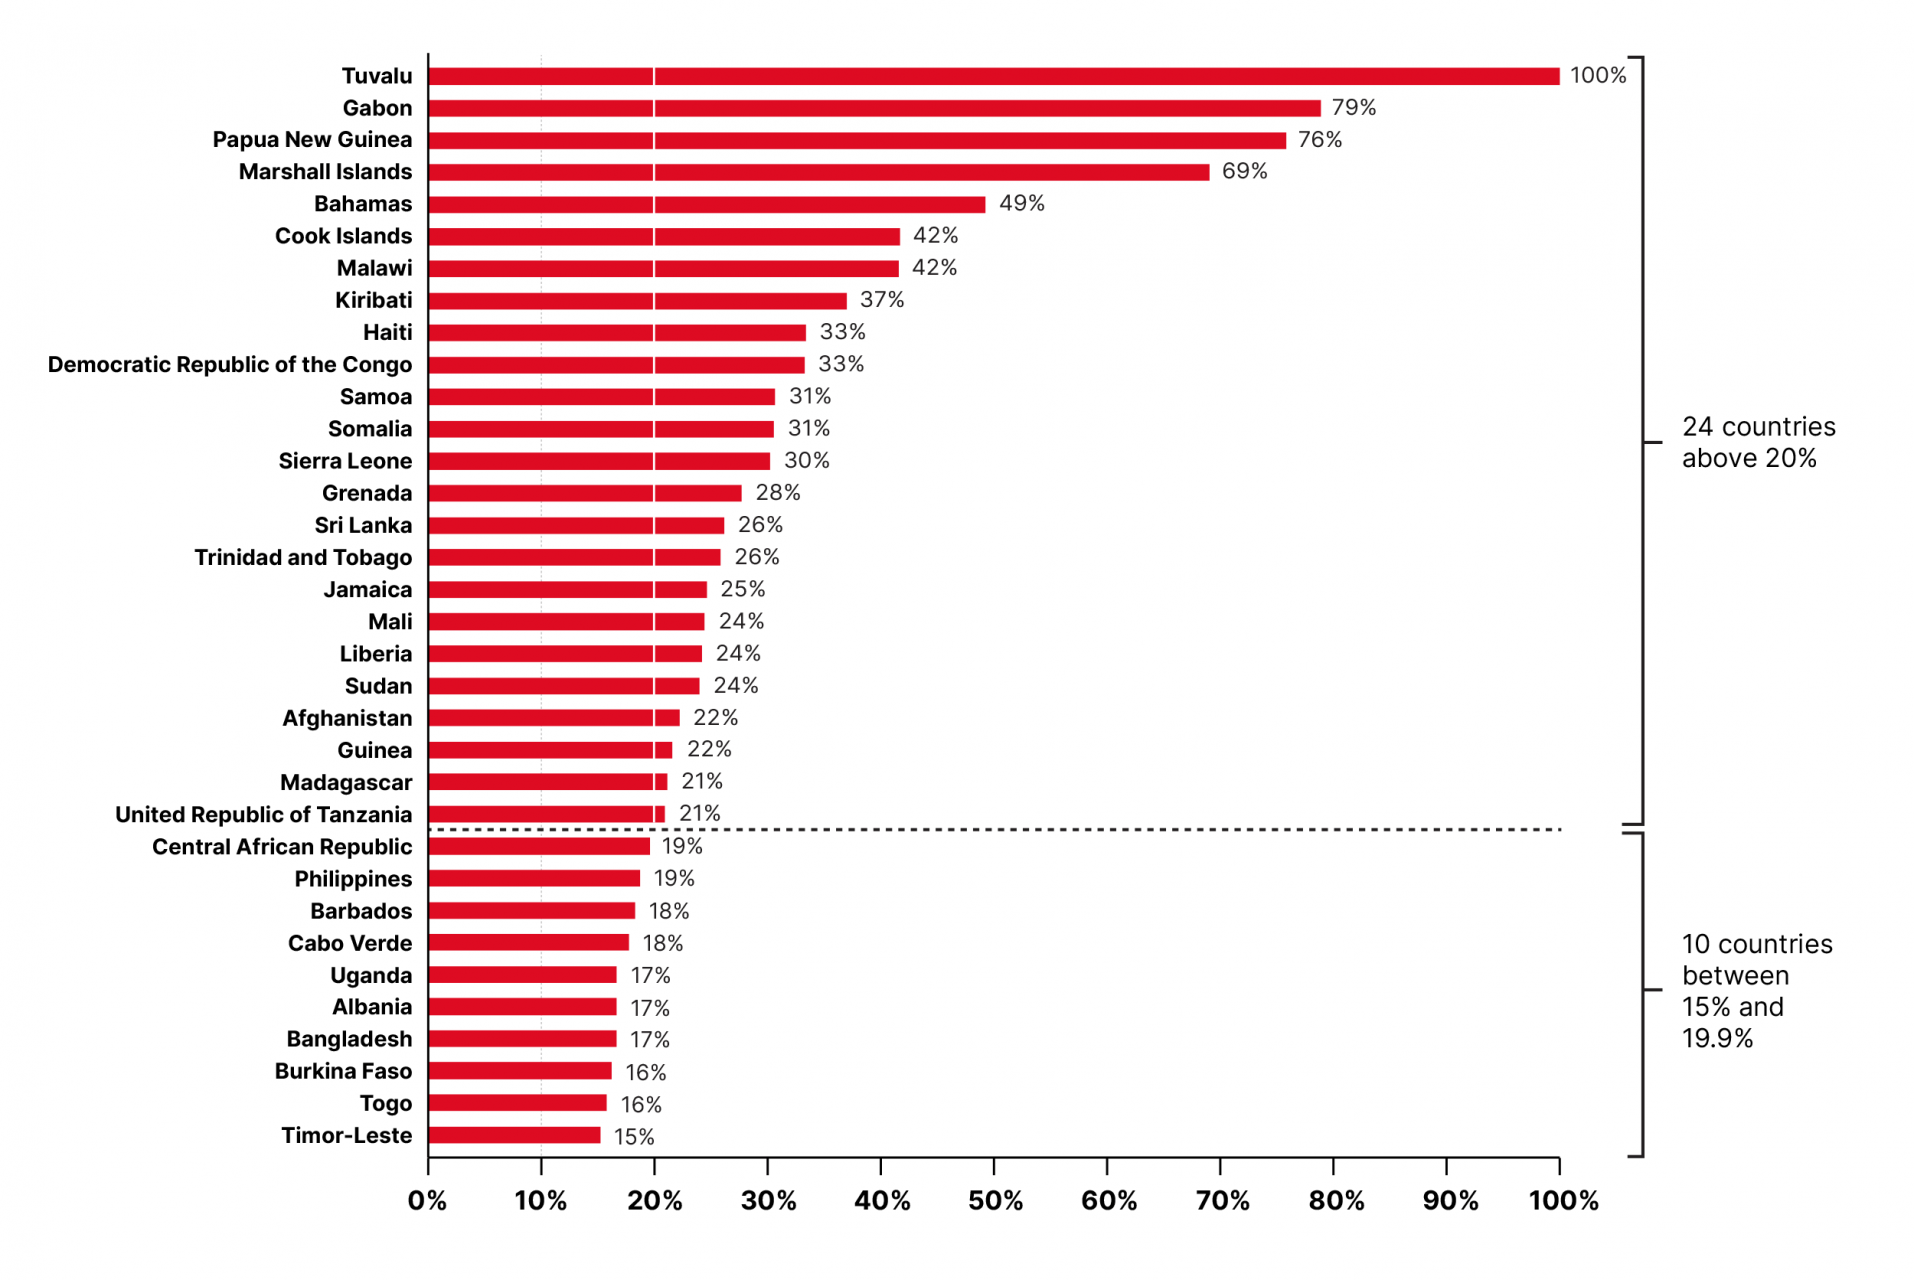
Countries in which more than 15% of earmarked resources is chanelled through development-related expenditure UN Inter-agency pooled funds, 2022 (34 countries)

Key insights in a flash
Report of the Secretary-General (A/79/72 - E/2024/12) and UN Pooled Funds Database.
The OECD-DAC members’ total use of earmarked resources channelled by the World Bank Group grew from US$ 2.7 billion to US$ 12.1 billion between 2021 and 2022. This US$ 9.4 billion increase is primarily attributable to funding from the United States to Ukraine, which involved US$ 8.5 billion channelled through the International Development Association.25 In 2021, total earmarked contributions from the United States to the World Bank Group stood at just US$ 0.1 billion.
The ‘other multilateral institutions’ category also saw a sub-stantial increase, doubling its funding from US$ 9.3 billion in 2011 to US$ 18.6 billion in 2022. As depicted in Figure 24’s detail, this growth is primarily fuelled by resource mobilisation of global vertical funds within the development sphere.
The funding profiles among multilateral institutions vary widely depending on their mandates and governance structures. The UN system’s relatively large share of earmarked funding may in part be down to its strong track record of channelling humanitarian relief resources when faced by crises and emergency responses that exceed an individual nation’s capacity – as was the case during the COVID-19 pandemic. This humanitarian assistance is largely funded by earmarked resources.
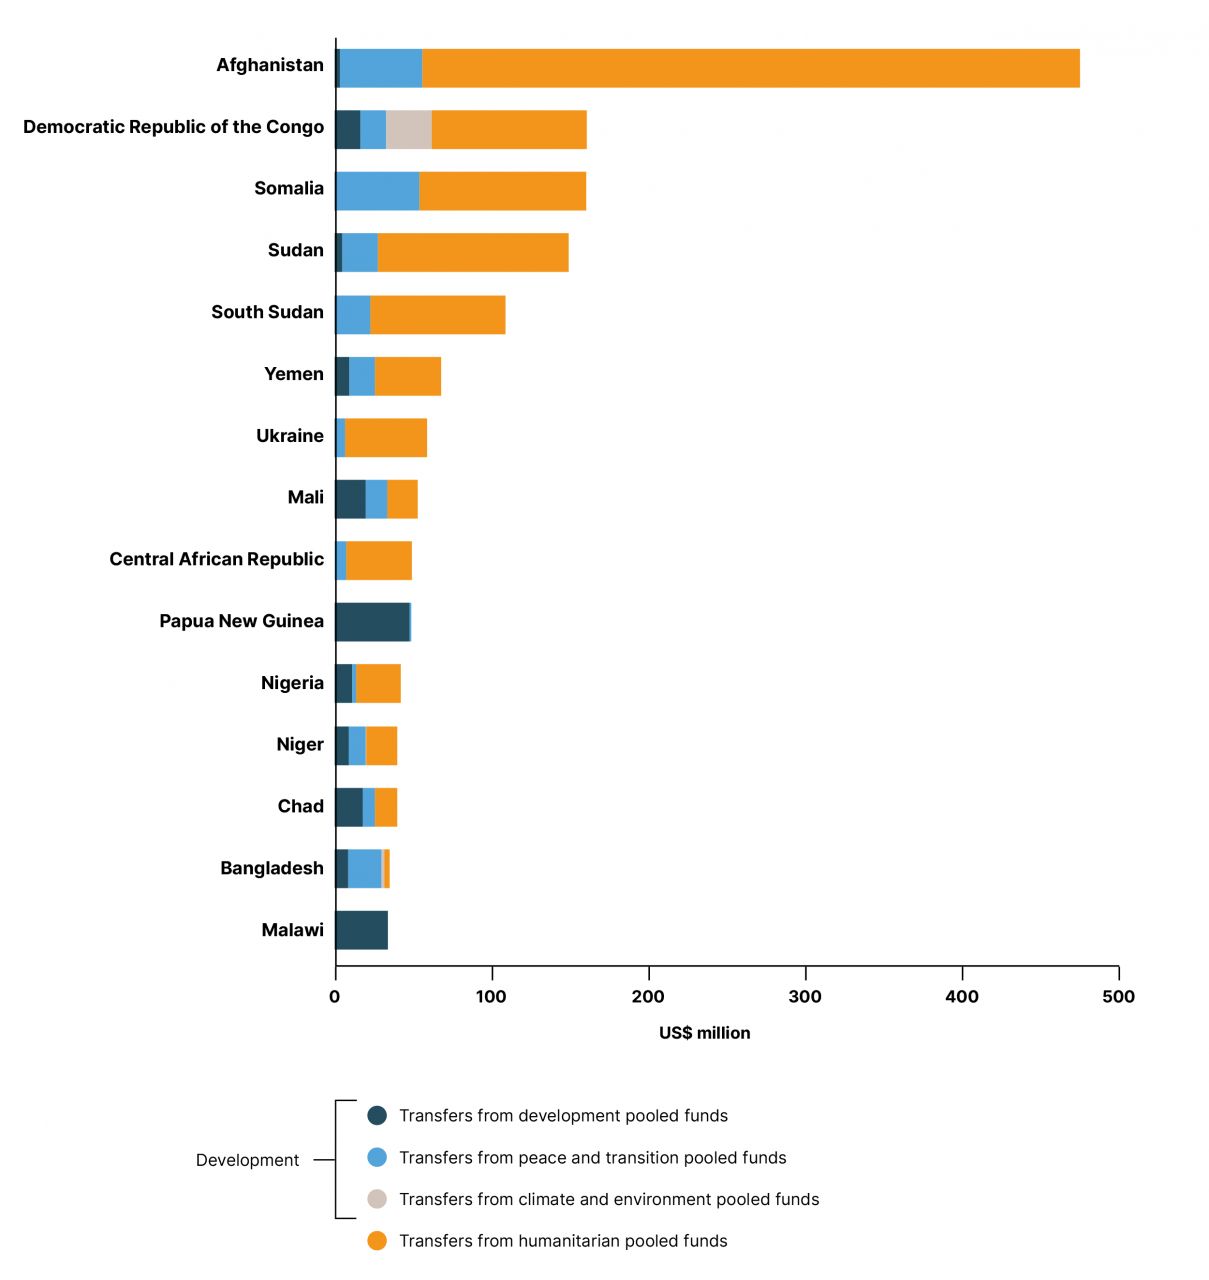
Top 15 countries receiving resources through UN inter-agency pooled funds, 2022 (US$ million)

Key insights in a flash
UN Pooled Funds Database.
Channels of multilateral assistance from OECD-DAC countries, core and earmarked,2011 and 2022
Organisation for Economic Co-operation and Development (OECD)