Having outlined how expenditure is distributed across the UN’s different functions, this section turns to the relationship between resource allocations and geography, as well as a country’s income status.
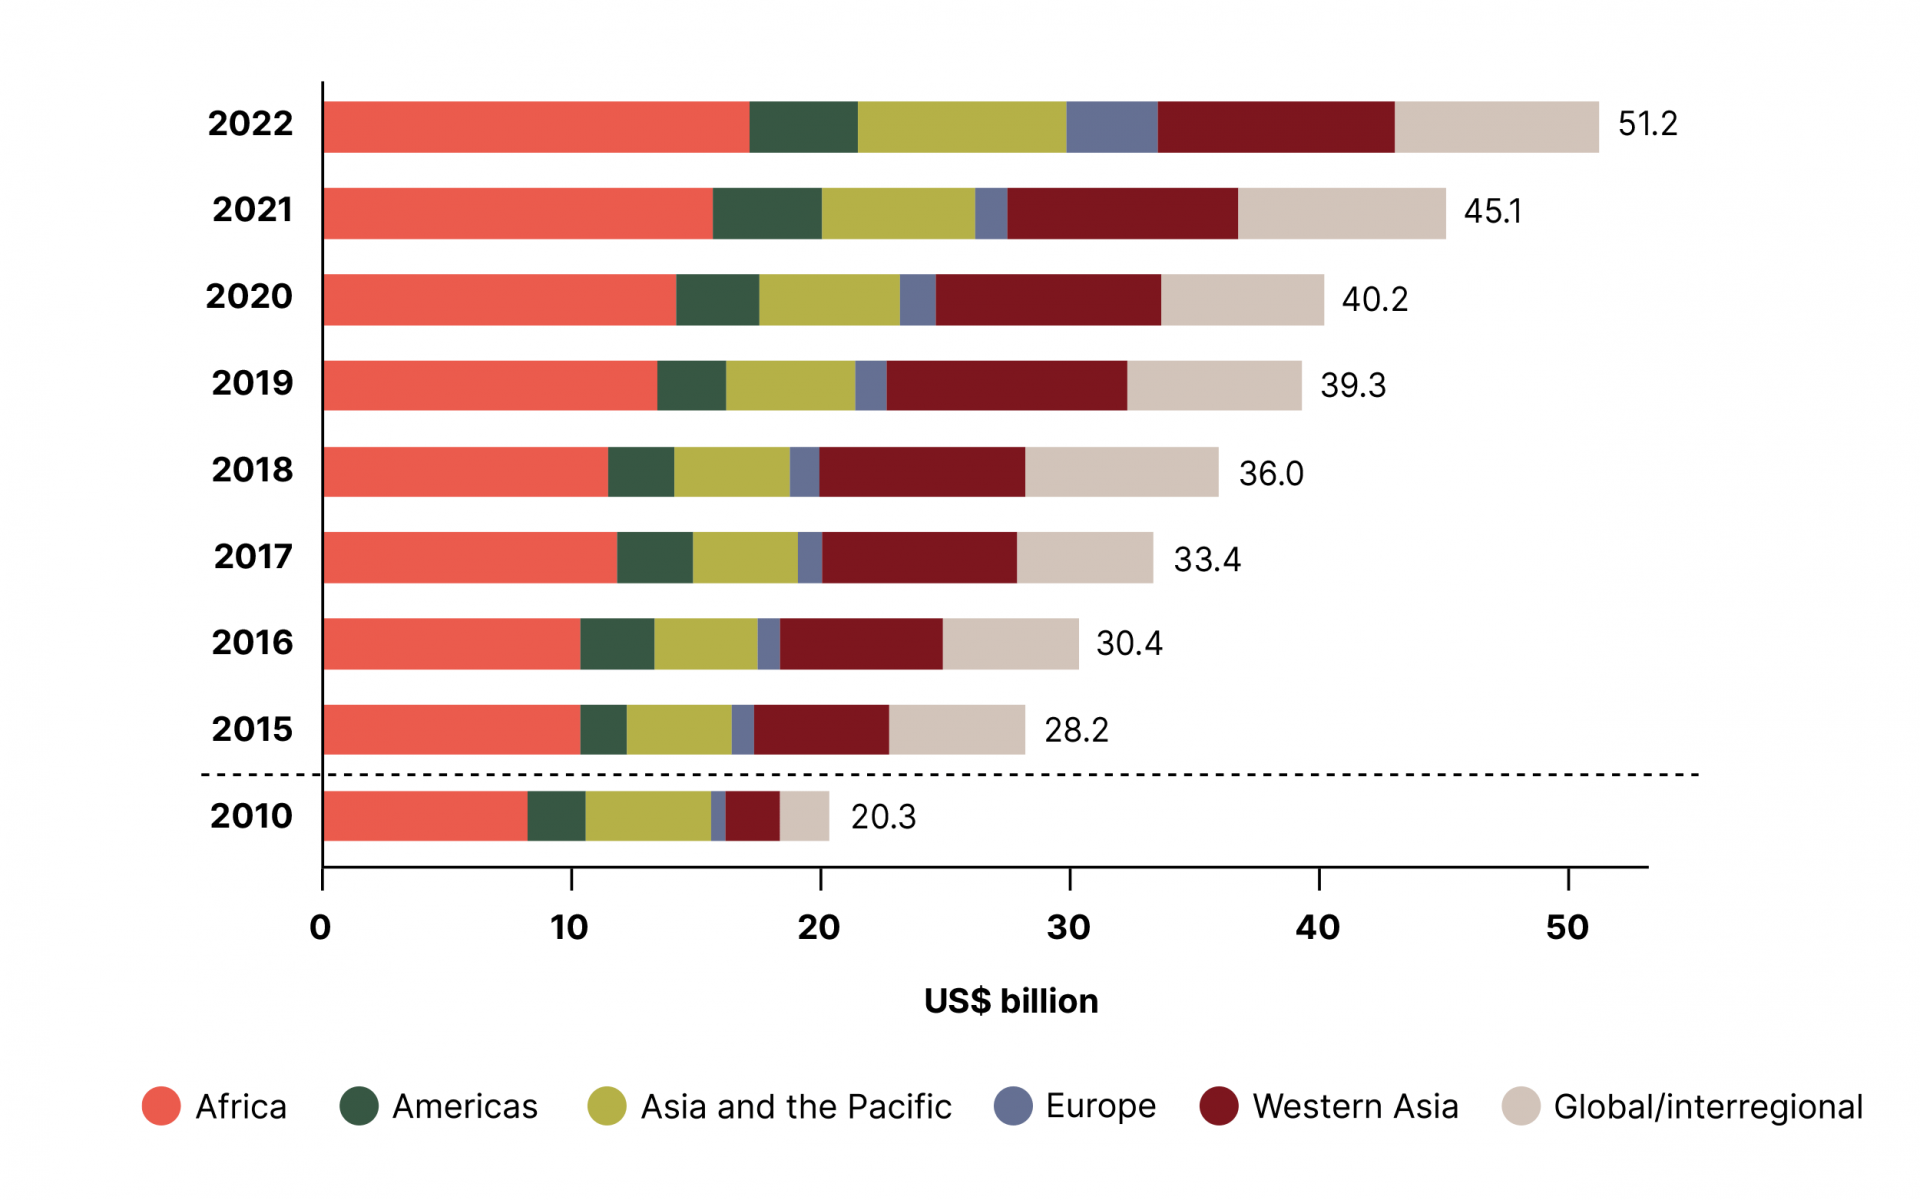
Figure 28 provides an overview of how UNDS expenditure has evolved by region since 2010. Africa and Western Asia had the largest shares of UN OAD expenditure in 2022, receiving 34% and 19% respectively of the US$ 51.2 billion distributed. Notably, Europe saw the highest growth between 2021 and 2022, with expenditures surging from US$ 1.3 billion to US$ 3.7 billion. This 2022 total includes US$ 2.2 billion allocated to address critical humanitarian needs resulting from the intensified armed conflict in Ukraine. Here, the US$ 2 billion allocated to address critical humanitarian needs in 2022 can mostly be attributed to the intensified armed conflict in Ukraine.
The growth of UNDS allocations in Africa – from US$ 8.3 billion in 2010 to US$ 17.2 billion in 2022 – is largely down to multiple humanitarian crises, with more than 60% of expenditure going towards humanitarian assistance. More specifically, higher expenditure on emergency relief efforts can be explained by protracted armed conflicts in the Democratic Republic of the Congo, Ethiopia, Somalia, South Sudan and Sudan, combined with climate-related crises, natural disasters and epidemics. The UNDS has also implemented development programmes in Africa focused on, among others, poverty reduction, climate adaptation and mitigation, education, healthcare, agriculture, equality for women and girls, and infrastructure development.
Expenditure on UN humanitarian and development assistance by region, 2010-2022 (US$ billion)

Key insights in a flash
Report of the Secretary-General (A/79/72 - E/2024/12). Historical data from various reports.
UNDS allocations in Western Asia have seen more rapid growth than in Africa, increasing from US$ 2.2 billion in 2010 to US$ 9.5 billion in 2022. The growth from 2017 onwards is mainly connected to successive crises in Yemen, which have accounted for 28% of the region’s expenditure. Moreover, humanitarian crises in Syria have driven increased expenditure since 2012, also affecting humanitarian support to neighbouring countries such as Jordan, Lebanon and Türkiye, where many Syrian refugees have been hosted.
The surge in UN OAD expenditure in Asia and the Pacific – from US$6.1 billion in 2021 to US$ 8.3 billion in 2022 – was largely driven by the US$ 3.3 billion allocated to address Afghanistan’s spike in humanitarian and development needs following the 2021 withdrawal of United States and NATO troops, and the subsequent Taliban take-over. More than 28 million people, or two-thirds of the country’s population, required assistance in 2022 as the deteriorating humanitarian situation led to higher poverty levels, severe food insecurity and widening gender inequalities. The crisis also saw Afghanistan’s internally displaced population swell to 3.2 million people, with Iran and Pakistan hosting a further 8.2 million Afghans.31
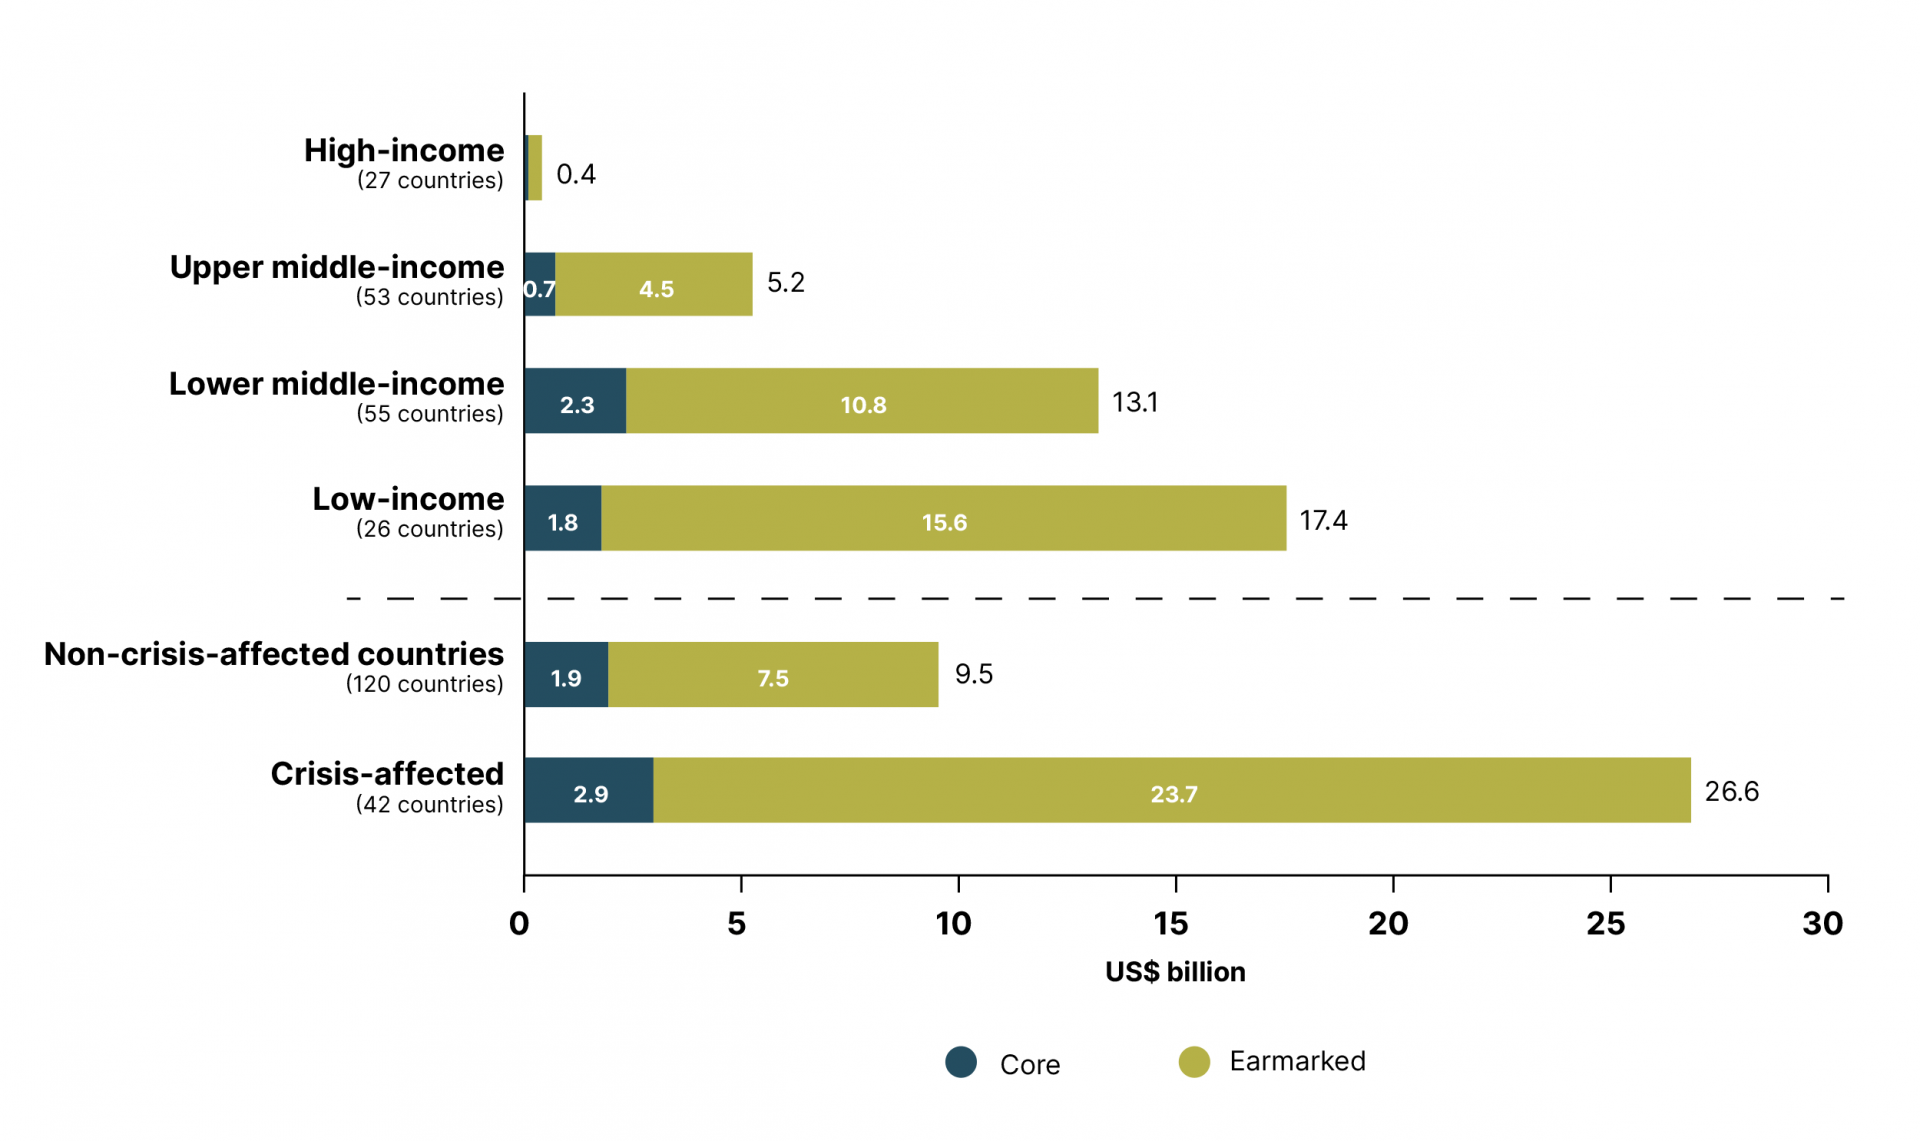
Figure 29 displays UN OAD expenditure in relation to the income level of UN programming countries, adding the perspective of crisis-affected versus non-crisis-affected countries. Here, it should be noted that there is a difference in the sum of values between figures 28 and 29 due to the latter only including resources linked to a specific country and not those allocated at a global or regional level.
Expenditure on UN OAD in UN programming countries by income status, 2022 (US$ billion)

Key insights in a flash
Report of the Secretary-General (A/79/72 - E/2024/12), Financial report of United Nations peacekeeping operations (A/78/5 (Vol.II)), Secretary-General proposed programme budget for special political missions (A/78/6 (Sec. 3)/Add.1), World Bank.
Total allocations to low-income countries increased from US$ 16 billion in 2021 to US$ 17.4 billion in 2022. Notably, ODA funding to low-income countries is earmarked to a higher extent than support to higher-income UN programme countries. In 2022, only 10% of UN OAD to low-income countries consisted of core (assessed and voluntary core) funding.
Of the 162 UN programme countries, 42 are defined as conflict-affected countries, meaning they meet one or more of the following criteria: 1) reports expenditure for an ongoing or recently discontinued peacekeeping mission; 2) reports expenditure for an ongoing or recently discontinued political mission such as a group of experts, panel, office of special envoy or special adviser; 3) reports Peacebuilding Fund expenditure directed towards transition facilitation and cross-border peacebuilding of more than US$ 500,000; and 4) has a humanitarian response plan for 2021 or 2022.
Conflict as a development challenge severely threatens efforts to end extreme poverty in both low- and middle-income countries. According to the World Bank, an estimated 59% of the world’s extreme poor will live in countries affected by conflict, fragility and violence by 2030.33
The recipients of UN OAD within the crisis-affected countries group are predominantly low-income, although there are a few exceptions to this: Lebanon, Nigeria and Ukraine are classified as lower middle-income countries, while Colombia and Iraq are categorised as upper middle-income countries.34 Hazardous weather events, such as droughts, floods and other climate crises, have joined conflict among the root causes of famine and displacement. Notably, 80% of those displaced by conflict and persecution – refugees and internally displaced persons (IDPs) – originate from countries on the climate emergency frontlines.35
The UN established the least developed countries (LDCs) category as a means of recognising the special support measures needed to assist the least developed of developing countries. A country is designated an LDC if it meets the following three criteria: 1) an average per capita income below US$ 1,018, as established at the 2021 triennial review; 2) a low score on the Human Assets Index, which measures health and economic outcomes; and 3) economic and environmental vulnerability based on, among other thing, unstable agricultural production, exports and non-traditional activities.36 It is worth noting that many LDCs are either suffering from or emerging from conflict. Despite representing only 14% of the global population, LDCs host more than half the world’s extreme poor, while their economies account for just 1.3% of the global economy.
Given their low levels of income, LDCs face severe structural barriers to sustainable development, with an over-reliance on a limited number of primary commodities rendering them highly vulnerable to economic and environmental shocks. Some LDCs have diversified into the manufacturing sector, but often remain limited to products in labour-intensive industries, such as textiles and apparel.
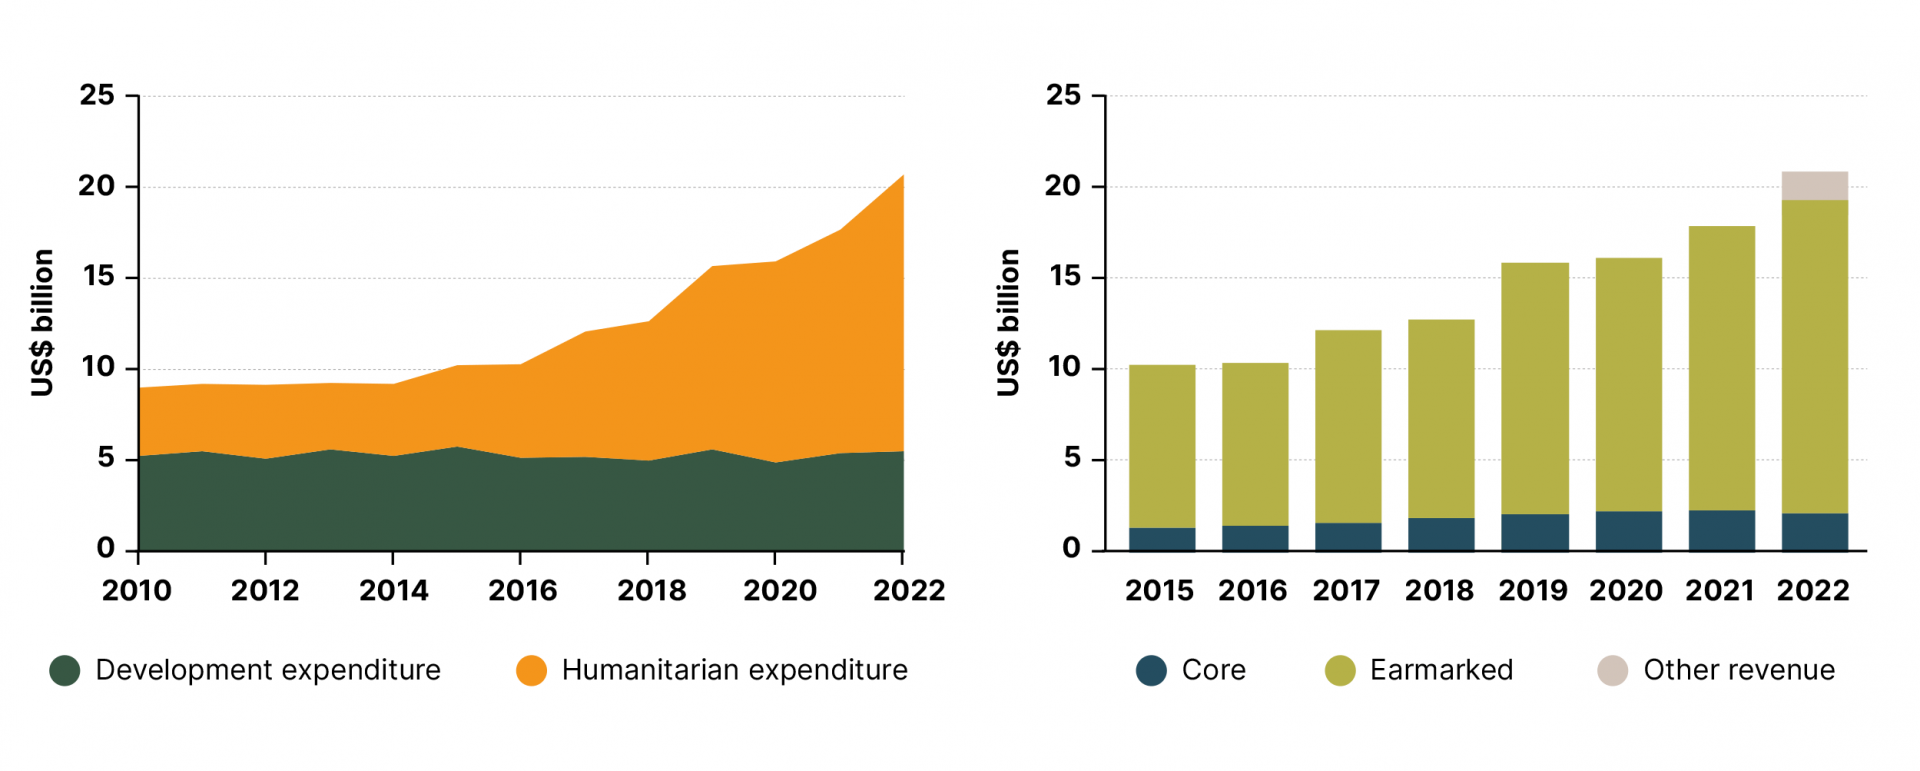
The left-hand side of Figure 30 depicts UN OAD expenditures in LDCs from 2010 to 2022, disaggregated by function. Following the overall distribution, the rise in allocations to LDCs was largely driven by an increase in humanitarian assistance. Total funding for humanitarian and development support in LDCs increased from US$ 17.6 billion in 2021 to US$ 20.6 billion in 2022, although only 26% of the latter was allocated to more long-term development assistance – down from 30% the year before. Meanwhile, the right-hand side of Figure 30 presents a breakdown of core- and earmarked-funded expenditure in LDCs during 2015–2022. Allocations to LDCs are primarily earmarked, oscillating between 85% and 89% of expenditure over the period – only 11% of UN expenditure was funded from core contributions in 2022. It should be noted that the 2022 data collection exercise introduced a new level of granularity to the breakdown of UN expenditure, including expenditures funded by revenue from other activities (ie an ‘other revenue’ category).
Expenditure on UN OAD in least developed countries, 2010-2022 (US$ billion)

Key insights in a flash
Report of the Secretary-General (A/79/72 - E/2024/12). Historical data from various reports.
Endnotes
UN High Commissioner for Refugees (UNHCR), ‘Afghanistan Humanitarian Crisis’, www.unrefugees.org/emergencies/afghanistan/.
World Bank, ‘Fragility, conflict & violence’, www.world-bank.org/en/topic/fragilityconflictviolence/overview.
World Bank classifications are updated each year on 1 July and are based on the GNI per capita of the previous year (in this case, 2021). Lebanon was downgraded from an upper middle-income country to a lower middle-income country classification by the World Bank in 2022. This downwards reclassification reflects the severe economic and financial crisis experienced by the country, which has been marked by significant economic contraction, high inflation and sharp exchange rate depreciation.
UNHCR, ‘Key Messages and Calls to Action COP26’, www.unhcr.org/us/media/key-messages-and-calls-action-cop26.
The list of 46 LDC countries is available at www.un.org/development/desa/dpad/wp-content/uploads/sites/45/publicatio…. The list is reviewed every three years by the UN Committee for Development. To exit the LDC category, a country must meet the thresholds established for at least two of the three criteria for two consecutive triennial reviews.