Humanitarian and development-related activities
As figure 20 shows, total contributions to UN inter-agency pooled funds have more than doubled over the past decade, from US$ 1.5 billion in 2015 to a peak of US$ 3.4 billion in 2021, before dropping to US$ 3.0 billion in 2024. This represents 3% of total earmarked contributions to the UN system (See Figure 5) and 5% of total earmarked contributions to the UNDS (see Figure 15). More than half these contributions (55%) supported country-level funds, while 39% was allocated to global funds. The remaining 6% went to regional funds.
In 2024, humanitarian funds received US$ 1.8 billion in contributions. The majority of the humanitarian portfolio consists of OCHA-administered funds directed towards emergency humanitarian action. These include the United Nations Central Emergency Response Fund (CERF), a global fund which received US$ 576 million in 2024 (and an estimated US$ 436 in 2025); the regional humanitarian pooled funds (RHPFs),44 which received US$ 59 million; and country-based pooled funds (CBPFs), which together received US$ 1.1 billion.
The development-related pooled funds portfolio incorpo-rates development funds, peace and transition funds, and climate and environment funds. Two main types of development-related funds are multi-partner trust funds (MPTFs) and stand-alone joint programmes (JPs) operating under a pass-through funding modality.45 In 2024, development-related pooled funds received US$ 1.2 billion in contributions, with MPTFs receiving 70% (US$ 825 million) and JPs the remaining 30% (US$ 354 million).
Contributions to UN inter-agency pooled funds, 2015–2024 (US$ billion)

Source: Report of the Secretary-General (A/81/75/Add.1-E/2026/61/Add.1) and UN Pooled Funds Database. Historical data from various reports.
MPTFs include global flagship initiatives such as the Peacebuilding Fund and the Joint SDG Fund, as well as pooled mechanisms supporting joint UN action on cross-cutting issues, such as gender-based violence, migration, disability inclusion and forest protection. Despite an annual funding compact target of US$ 500 million each, contributions to the Peacebuilding Fund and the Joint SDG Fund amounted to just US$ 126 million and US$ 90 million respectively in 2024. Meanwhile, the Central African Forest Initiative and the 2gether 4 SRHR were among the regional funds that in 2024 received a total of US$ 126 million in development inter-agency pooled fund contributions. At a country level, development MPTFs – which facilitate Resident Coordinator-led development support for national development plans, bringing together diverse partnerships under a common results framework– received US$ 220 million in contributions in 2024.
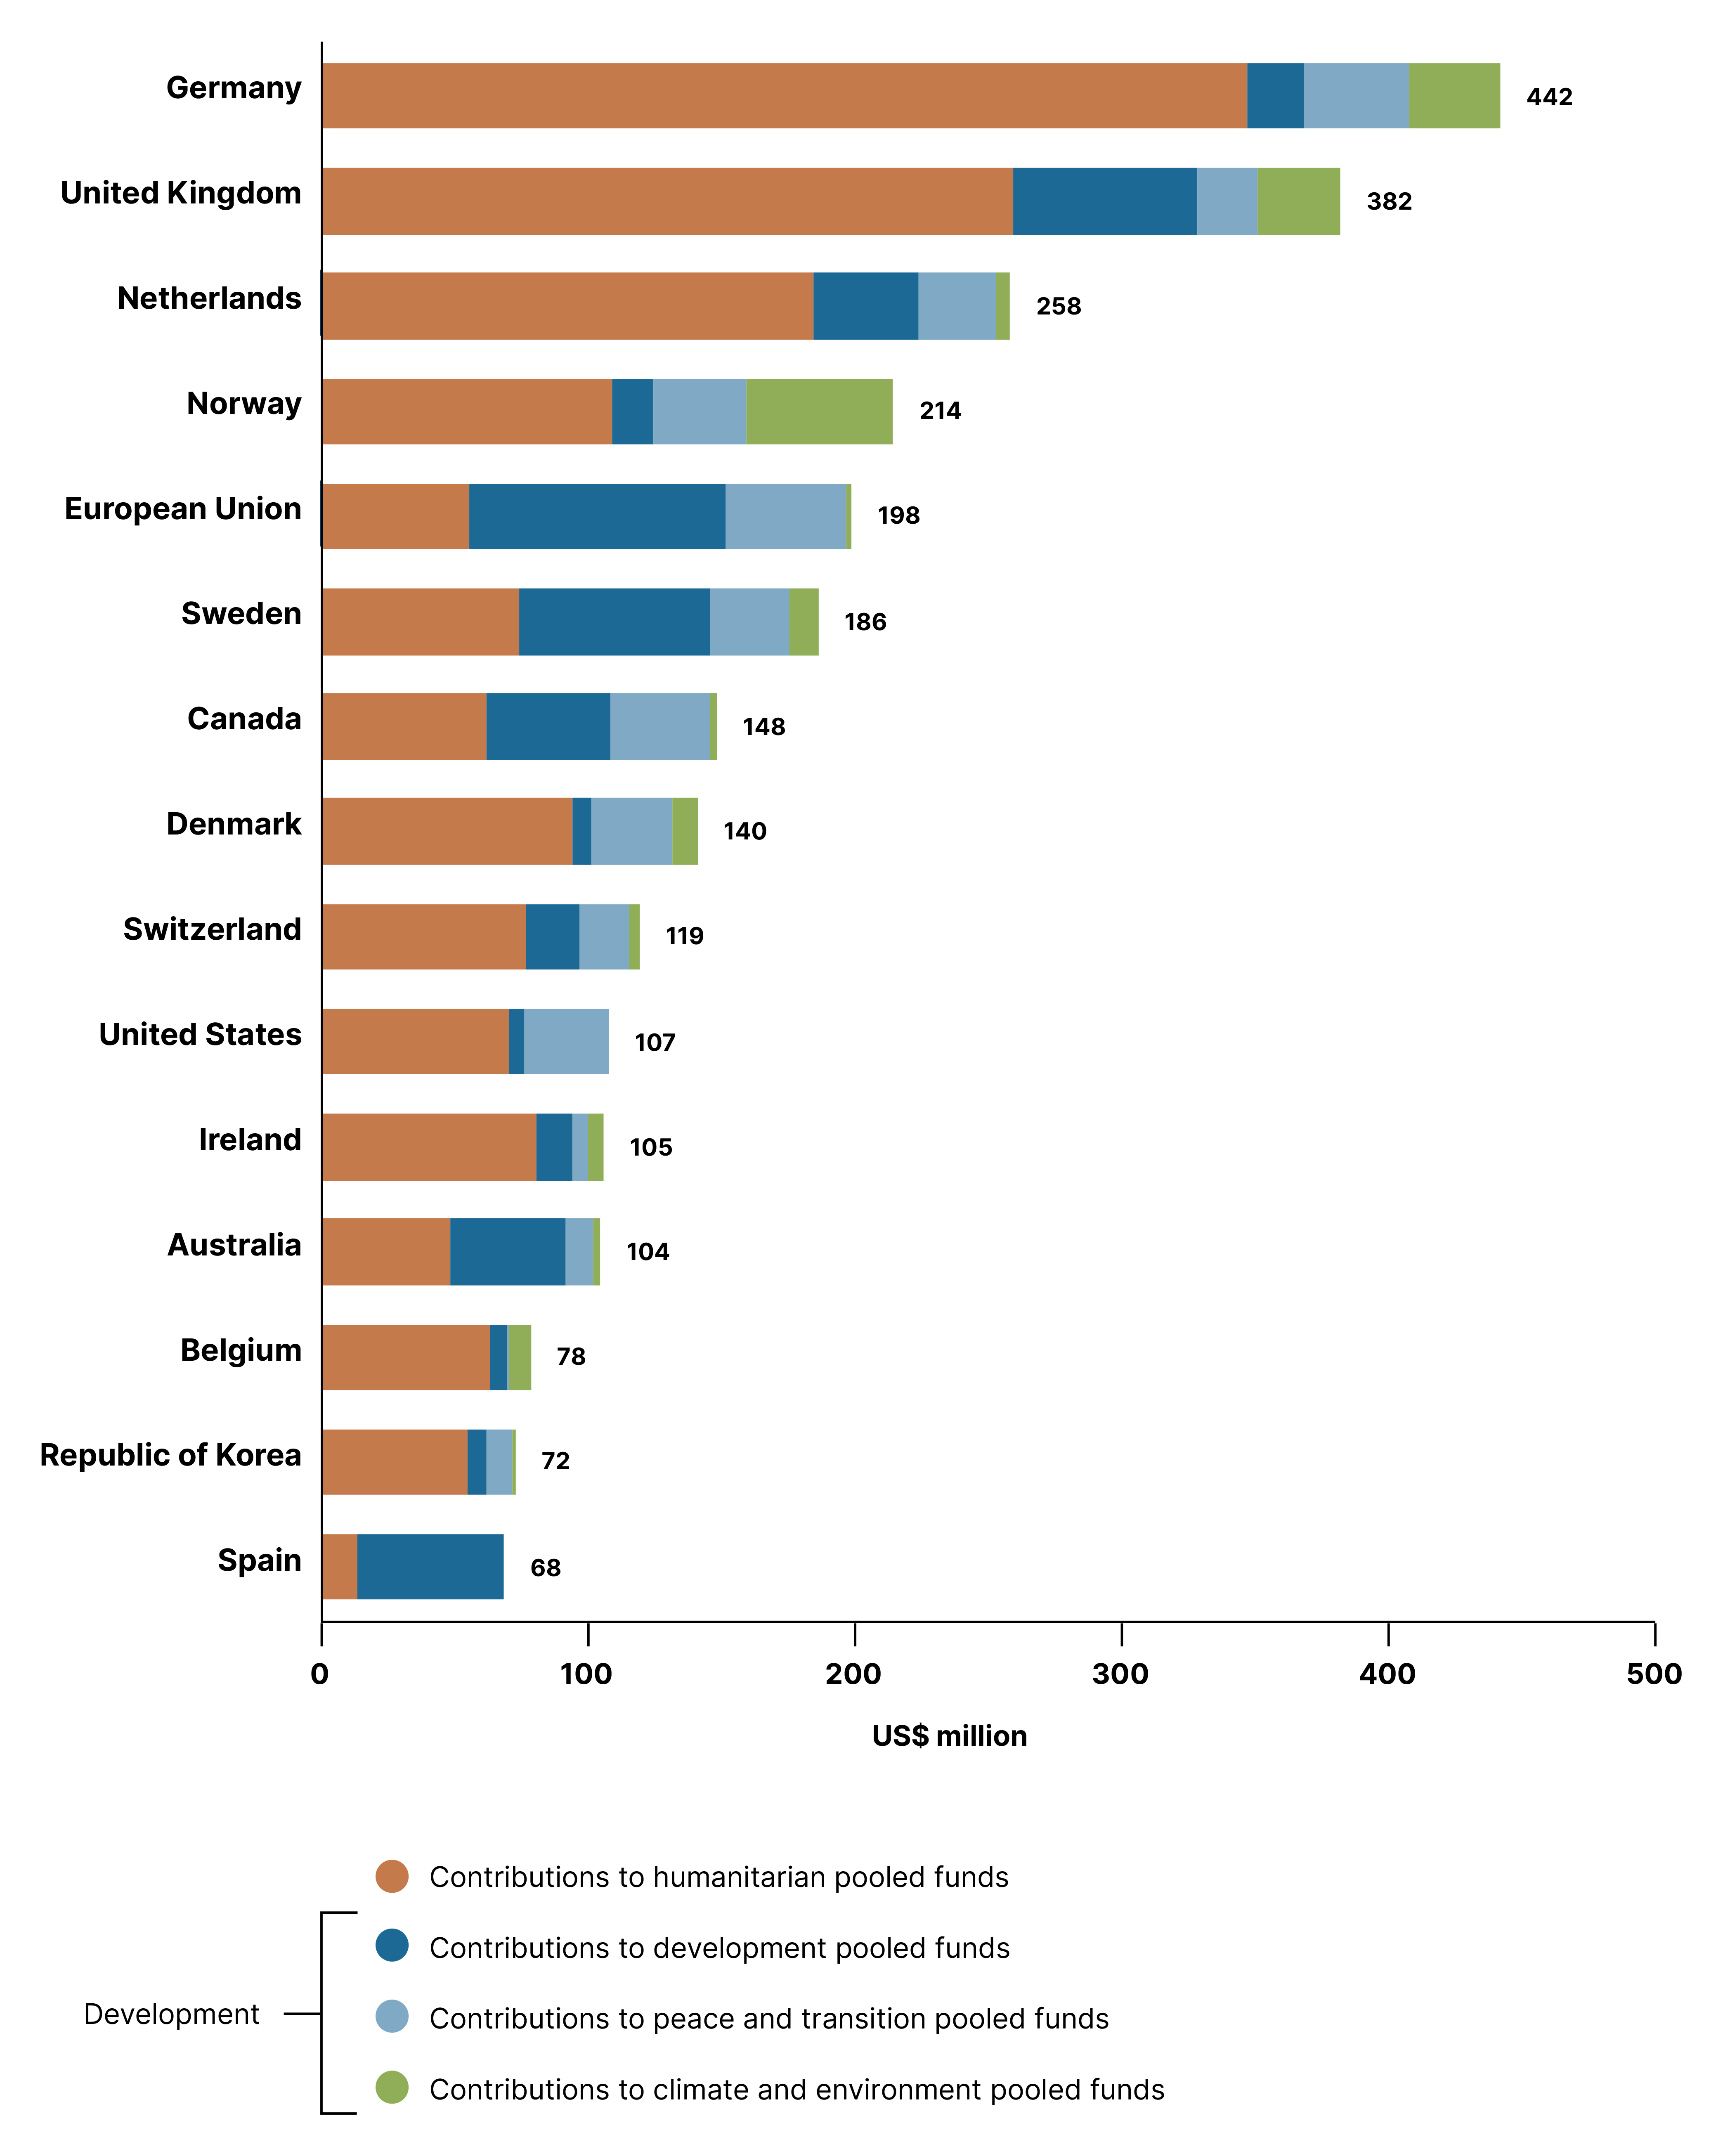
Funding of UN inter-agency pooled funds is highly concentrated among a small number of partners. The top 15 contributors in 2024 – all OECD-DAC members, as shown in Figure 21 – accounted for 88% of total contributions. Germany, the largest contributor, provided US$ 442 million, while the next two largest contributors, the United Kingdom and the Netherlands, provided US$ 382 million and US$ 258 million respectively. Combined, these three contributors provided more than US$ 1 billion of UN inter-agency pooled funding in 2024, under - scoring their leadership in advancing flexible, coordinated financing arrangements.
Contributions to UN inter-agency pooled funds by fund thematic area: Top contributors, 2024 (US$ million)
Source: UN Pooled Funds Database.
This concentration also highlights the exposure of UN inter-agency pooled funds to broader trends in ODA. Given the principal contributors to these financing mechanisms are OECD-DAC members, it is likely the increasingly constrained funding environment will put pressure on the volume of contributions to UN inter-agency pooled funds going forward.
Turning to resources transferred from UN inter-agency pooled funds for project/programme implementation, Figure 22 presents the top UN entities receiving such funding in 2024, disaggregated by thematic area. UNICEF was the top recipient of UN inter-agency pooled funds in 2024, having been allocated US$ 348 million, half of which came from development pooled funds. UNDP was second, with US$ 271 million, the vast majority of which (98%) was sourced from development-related funds, in line with its core mandate. WFP ranked third, with US$ 247 million, 73% of which came from humanitarian-themed funds.
Top implementing UN entities receiving revenue through UN inter-agency pooled funds, by fund thematic area, 2024 (US$ million)

Source: UN Pooled Funds Database.
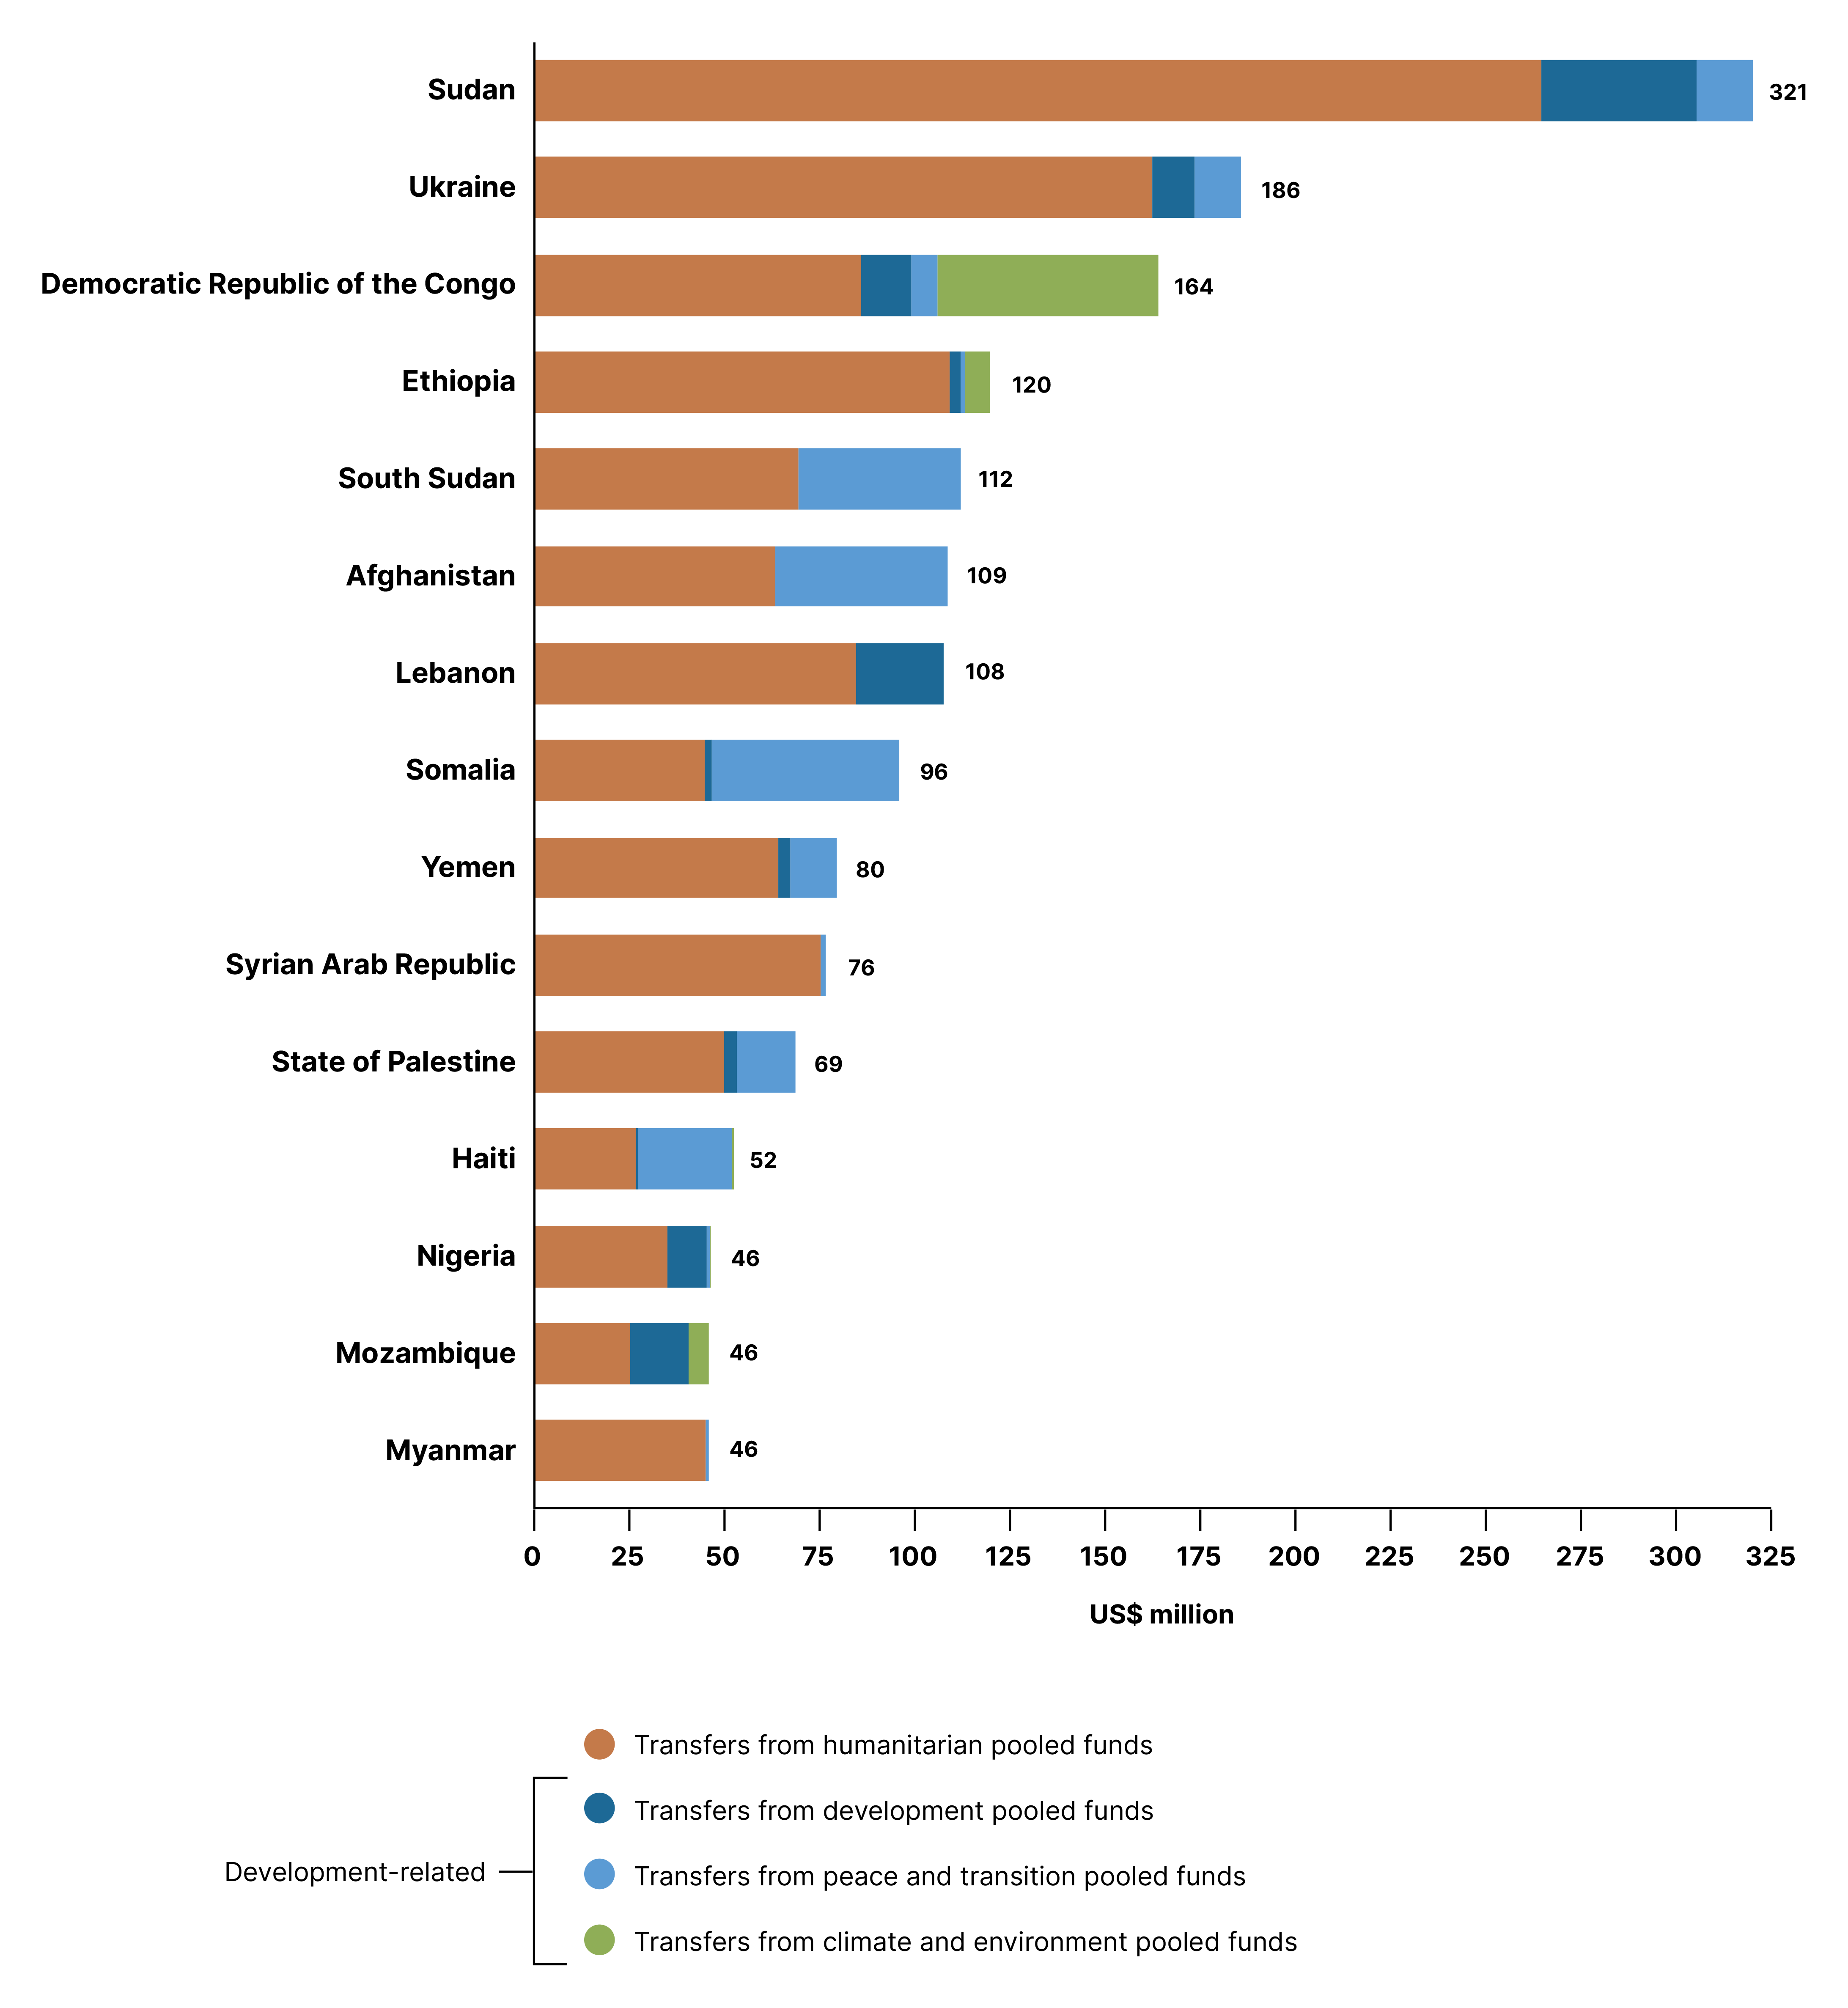
Figure 23 presents the top 15 countries/areas with the highest transfers from UN inter-agency pooled funds in 2024, disaggregated by thematic area. Sudan was the largest recipient with US$ 321 million. Of this, close to $200 million came from the Sudan Humanitarian Fund and US$ 66 million from CERF. Notably, Somalia is the only country among the top 15 recipients where development pooled funds accounted for more than half of total transfers, highlighting a funding profile distinct from the predominantly humanitarian focus observed in the other countries.
Top recipient countries or areas of UN inter-agency pooled funds transfers, 2024 (US$ million)
Source: UN Pooled Funds Database.
Development-related activities
Whereas the preceding part of this section presented overall trends in UN inter-agency pooled funds contributions, the following focuses specifically on development-related UN inter-agency pooled funds. In doing so, it takes into consideration the 2024 funding compact’s call for 30% of earmarked Member State contributions for development activities to be channelled through UN inter-agency pooled funds by 2027.
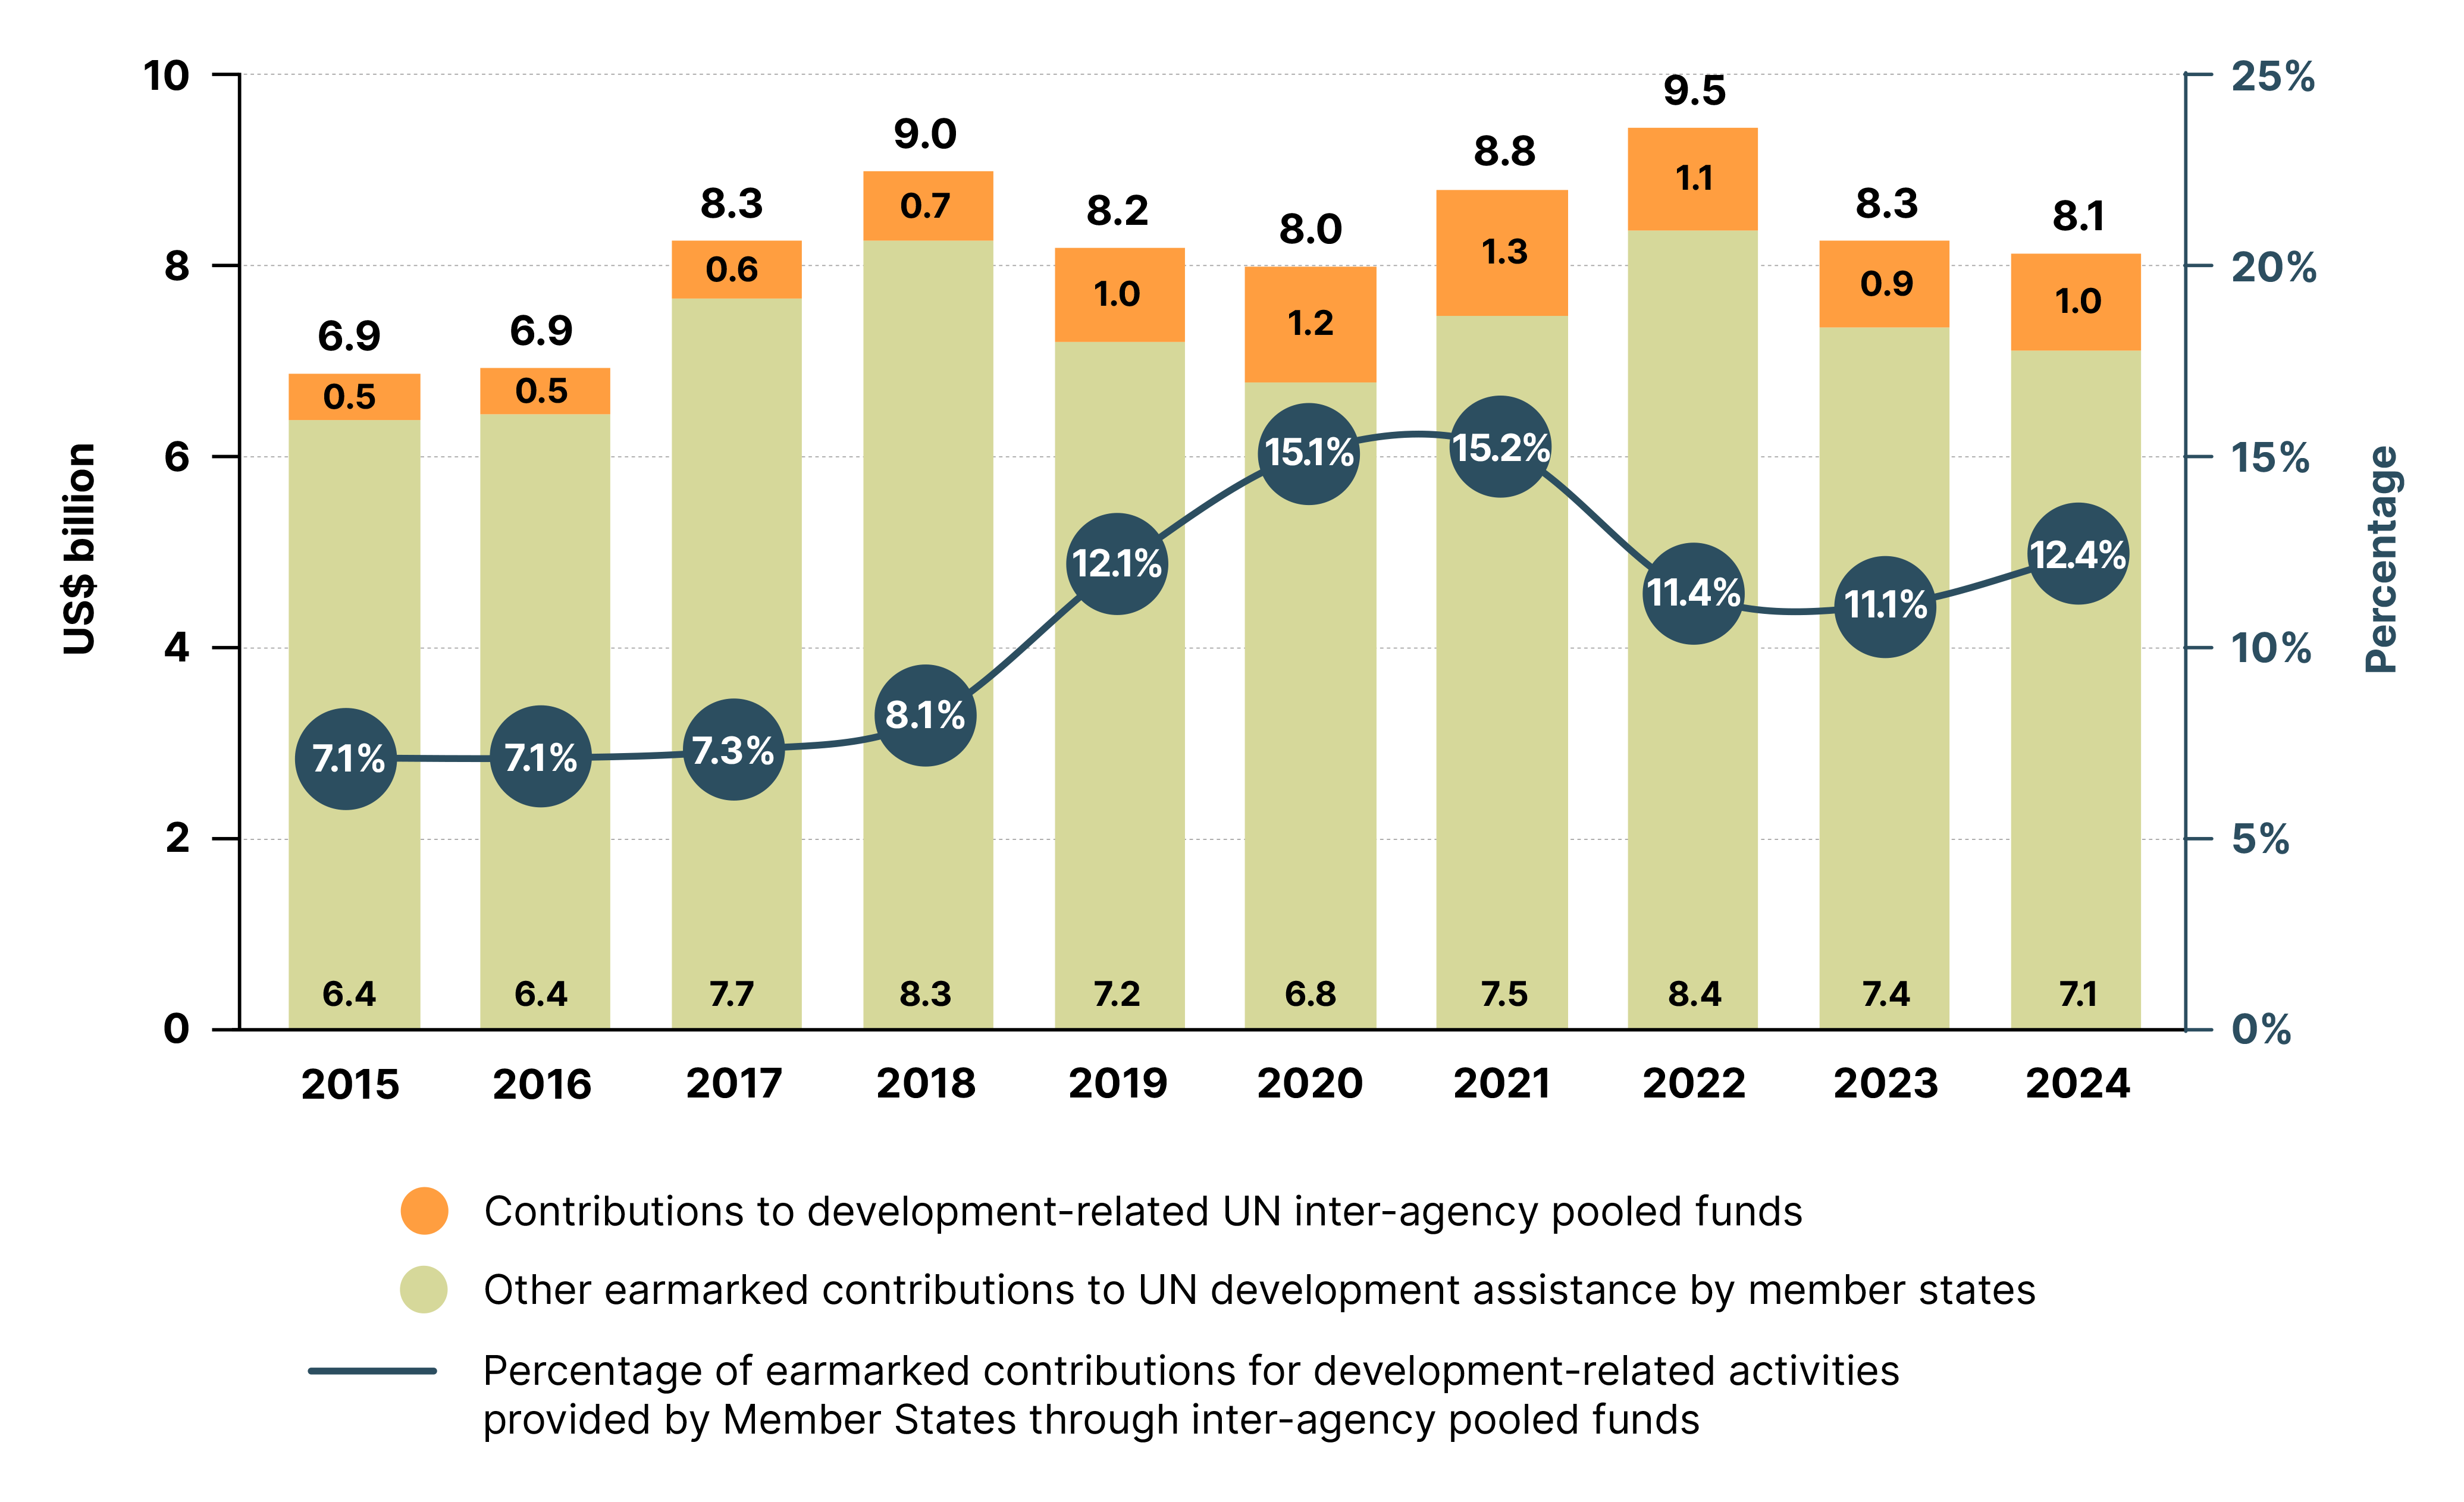
Figure 24 shows the annual recorded share of Member State earmarked contributions for development activities during the period 2015–2024, alongside total volumes, with a distinction made for contributions channelled through UN inter-agency pooled funds. In 2024, the indicator value was 12.4%. In 2024, the total volume of contributions for development-related activities channelled through UN inter-agency pooled funds amounted to US$ 1.2 billion, of which Member States contributed US$ 1.0 billion. This equates to an annual share of 12.4%, far short of the 30% target, highlighting the challenges of increasing Member State engagement with development-related inter-agency pooled funds.
Member State UN development earmarked funding, inter-agency pooled funds and other channels, 2015–2024 (US$ billion)
Source: Report of the Secretary-General (A/81/75/Add.1-E/2026/61/Add.1) and UN Pooled Funds Database. Historical data from various reports.
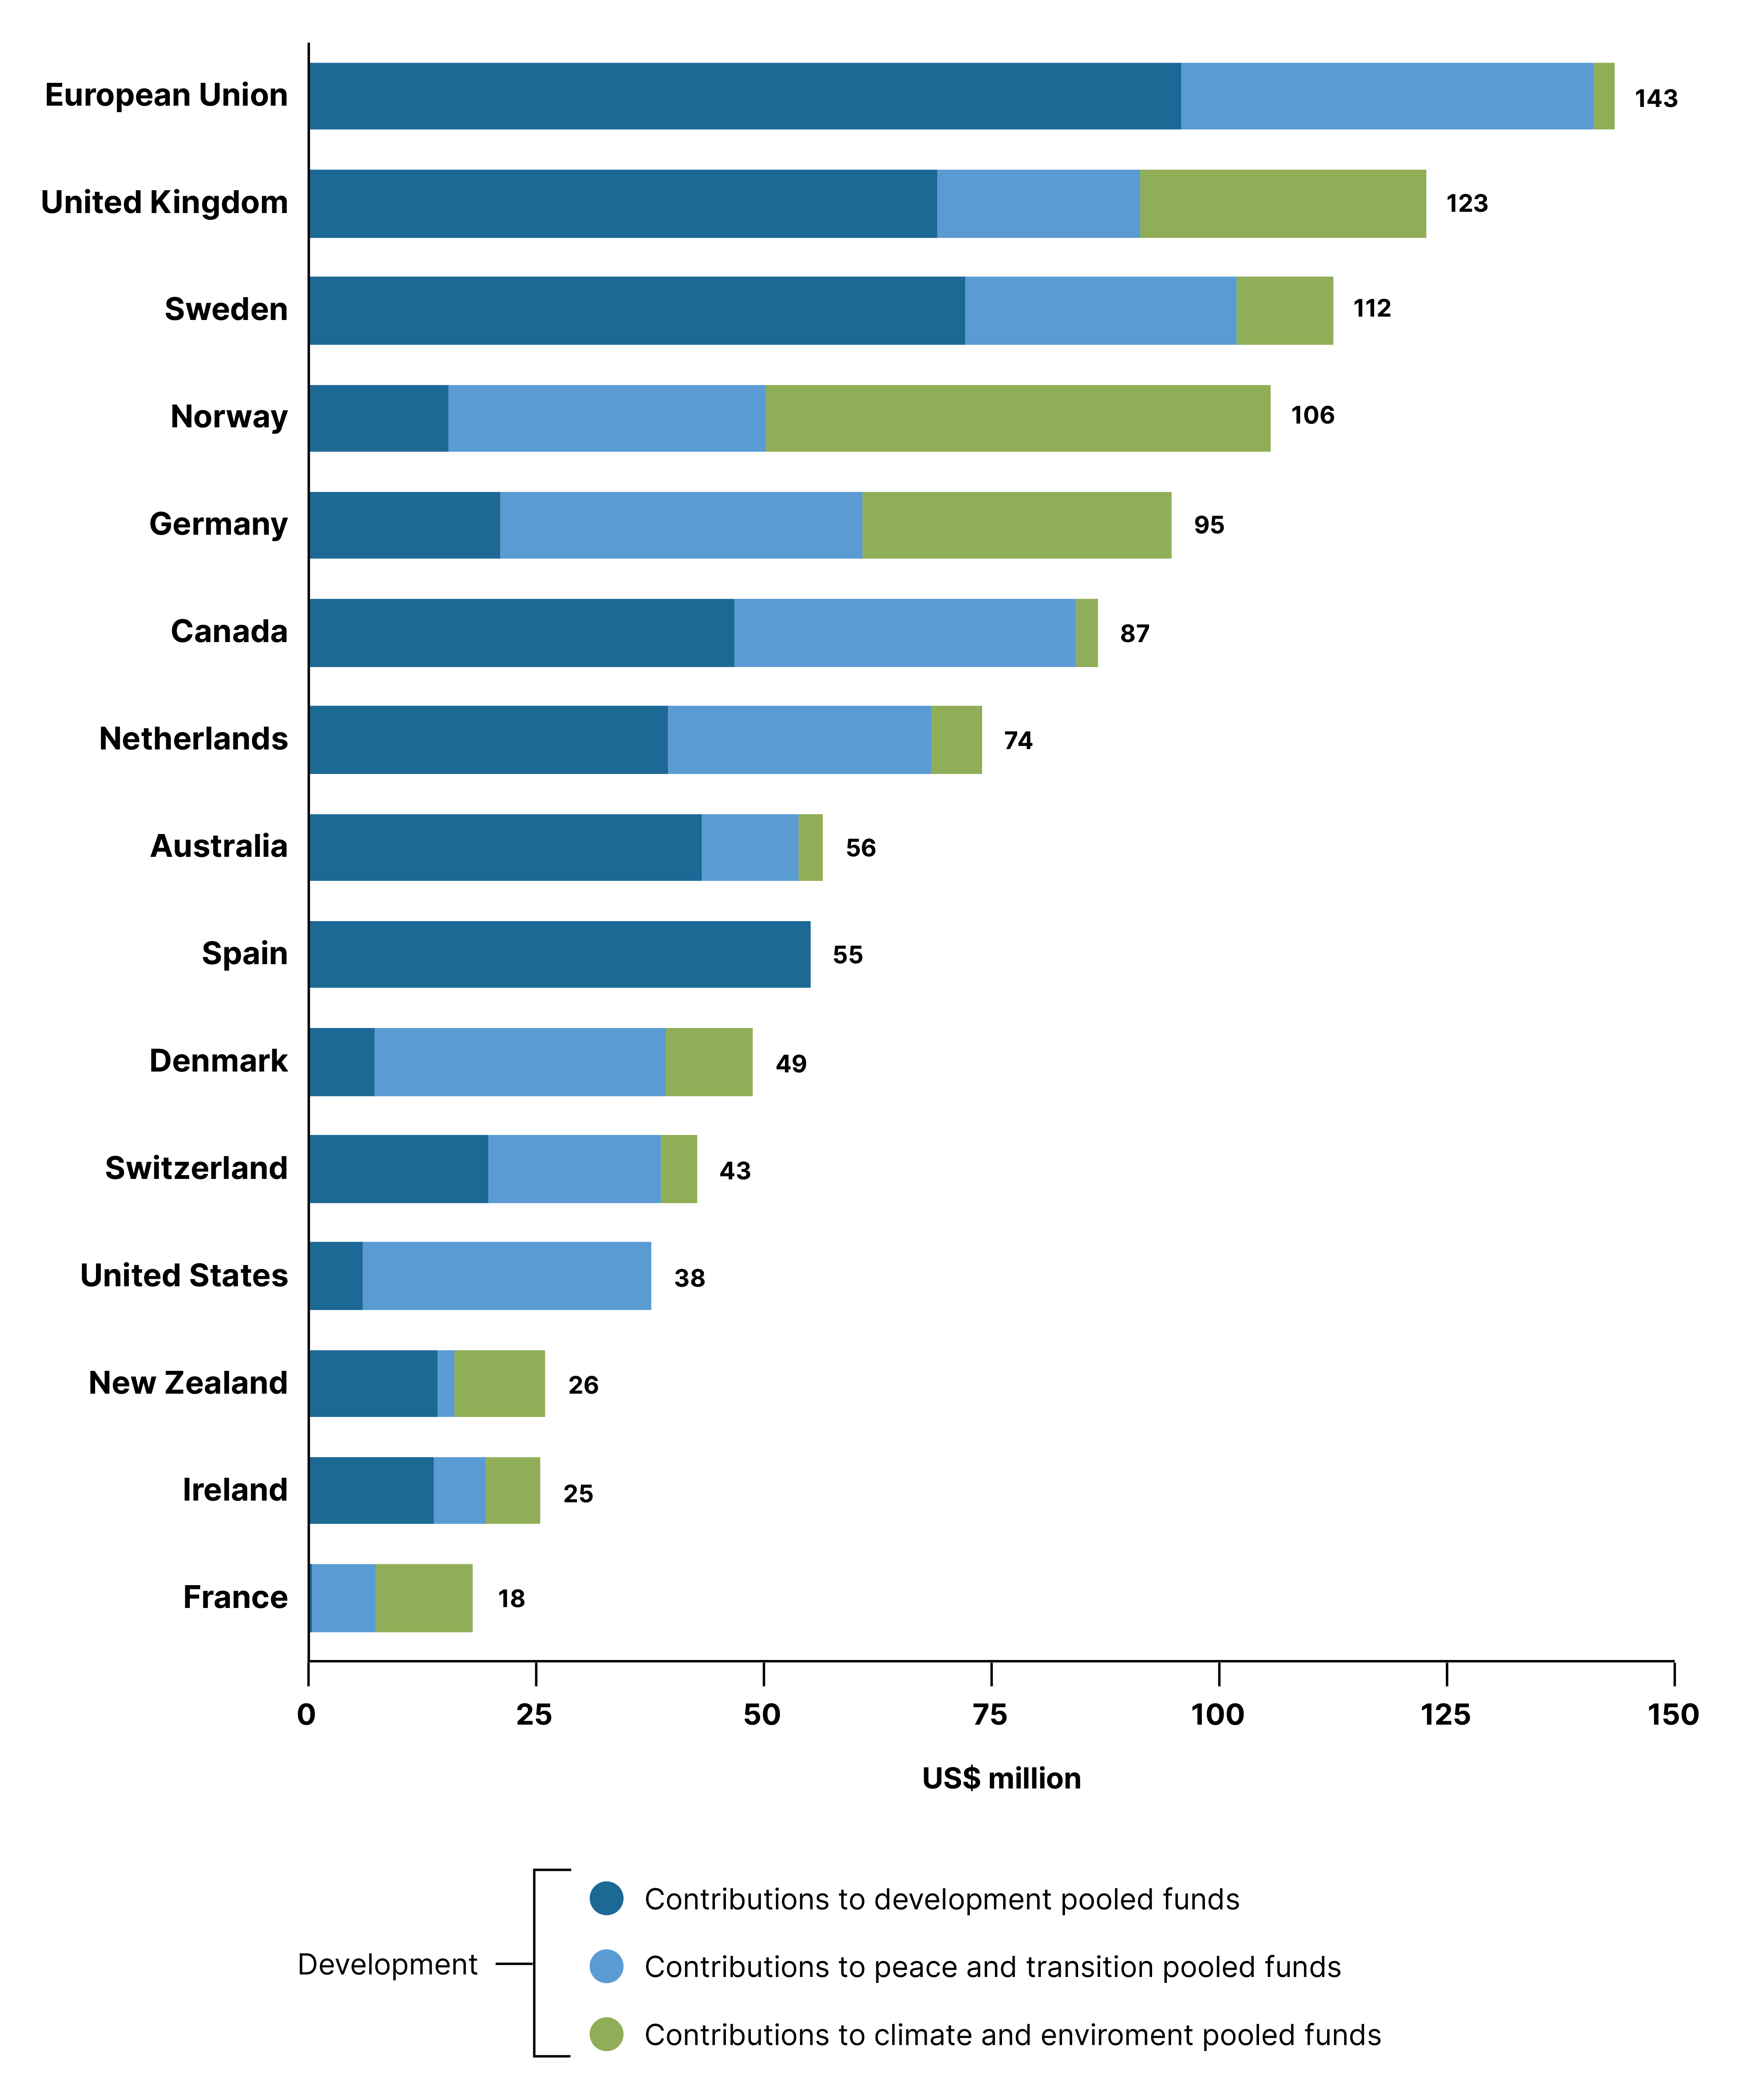
Building on the above, Figure 25 hones in on the top 15 contributors to development UN inter-agency pooled funds in 2024, which together account for 89% of total contributions. The EU was the largest contributor across all development-related categories, providing US$ 143 million, with the next two largest contributors, the United Kingdom and Sweden, contributing US$ 123 million and US$ 112 million respectively. Norway, with a notable emphasis on climate and environment funds, was the fourth major contributor with US$ 106 million, ahead of Germany (US$ 95 million).
Development UN inter-agency pooled funds by fund thematic area: Top contributors, 2024 (US$ million)
Source: UN Pooled Funds Database.
Whereas Figure 25 highlights the top donors’ total contributions in absolute terms, reflecting volume-based leadership, Figure 26 showcases Member States with a higher-than-average share of earmarked contributions to development activities channelled through UN inter-agency pooled funds. In this respect, two Member States surpassed the 30% mark: Azerbaijan and New Zealand.
Member States with above-average use of UN inter-agency pooled funds for devel-opment activities, 2024 (14 countries)

Source: Report of the Secretary-General (A/81/75/Add.1-E/2026/61/Add.1) and UN Pooled Funds Database.
Endnotes
In RHPFs, contributions are earmarked at the regional level and allocated to country envelopes by the Emergency Relief Coordinator, based on requests made by the Resident Coordinator (RC)/Humanitarian Coordinator (HC). Once funds are transferred to the country level, they are managed and overseen by the RC/HC.