Explore the data
Visualizations
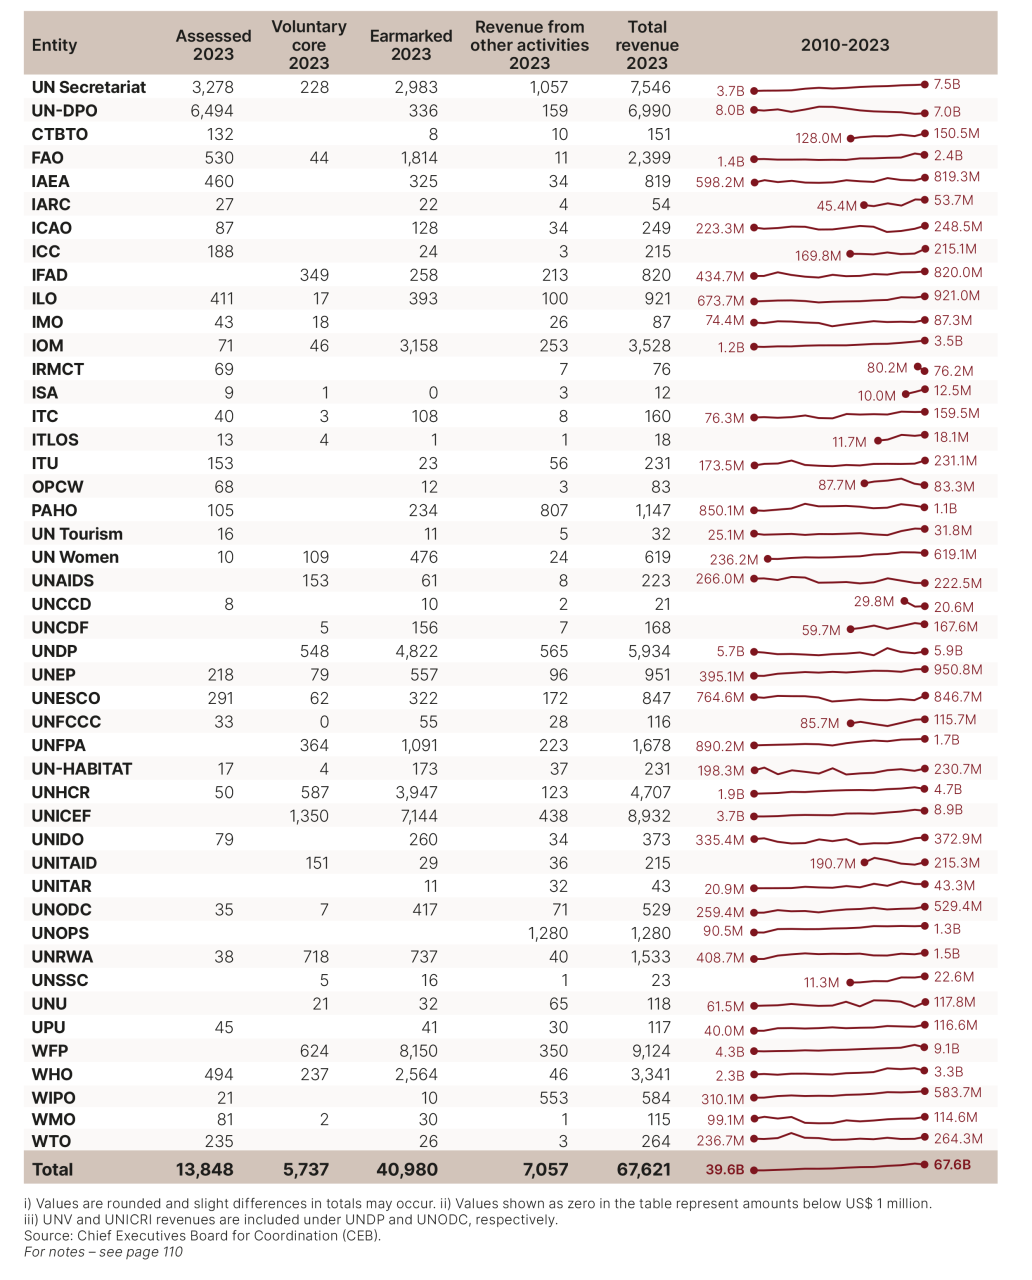
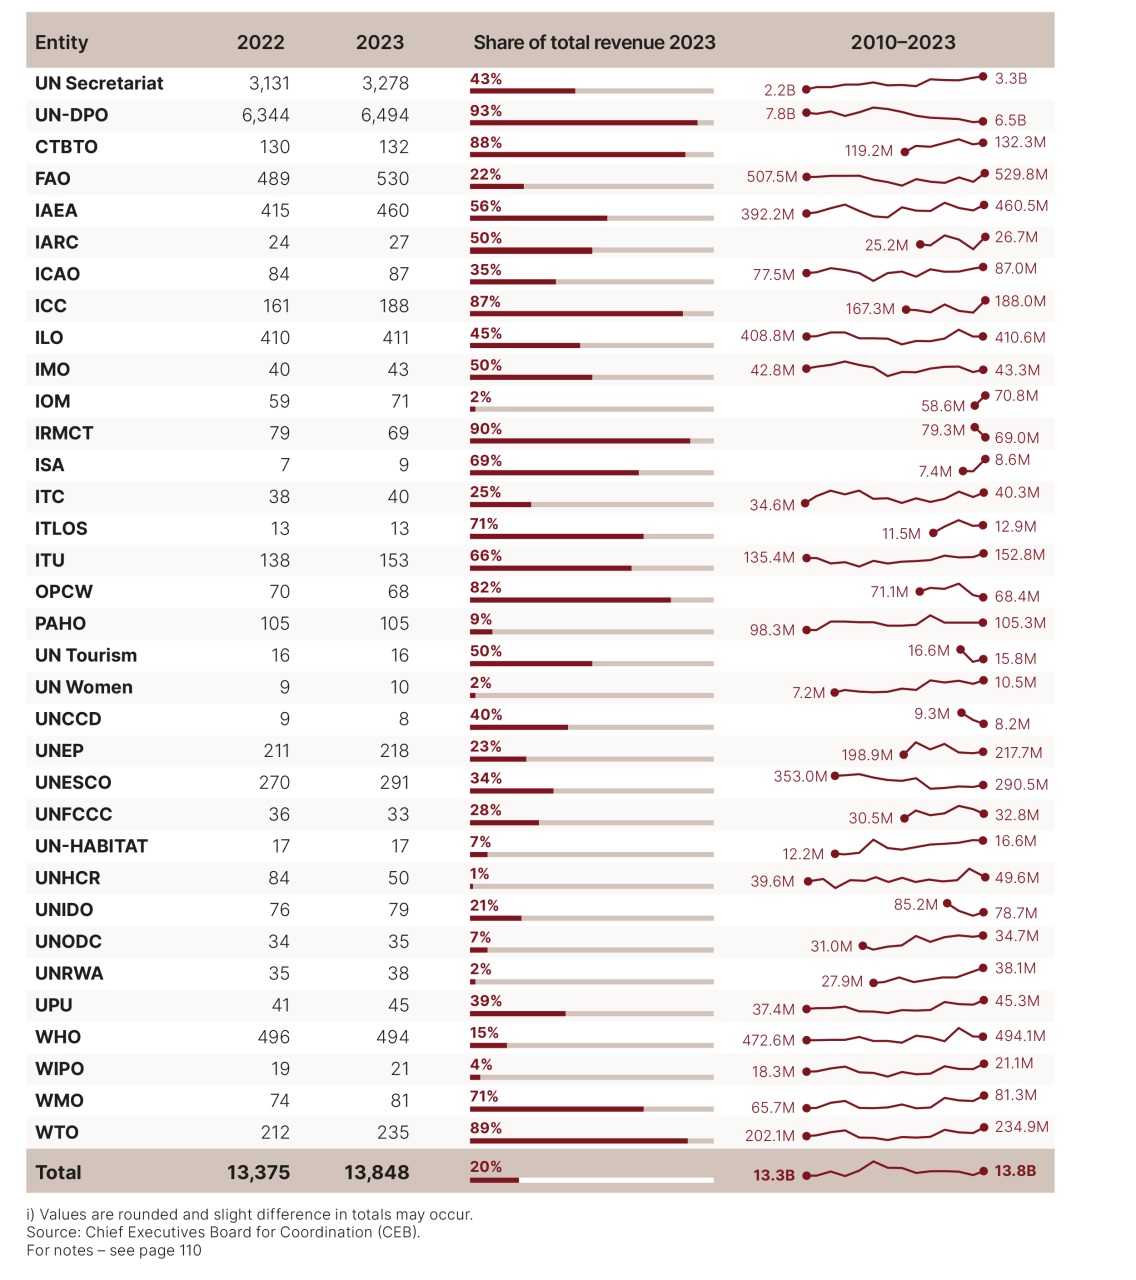
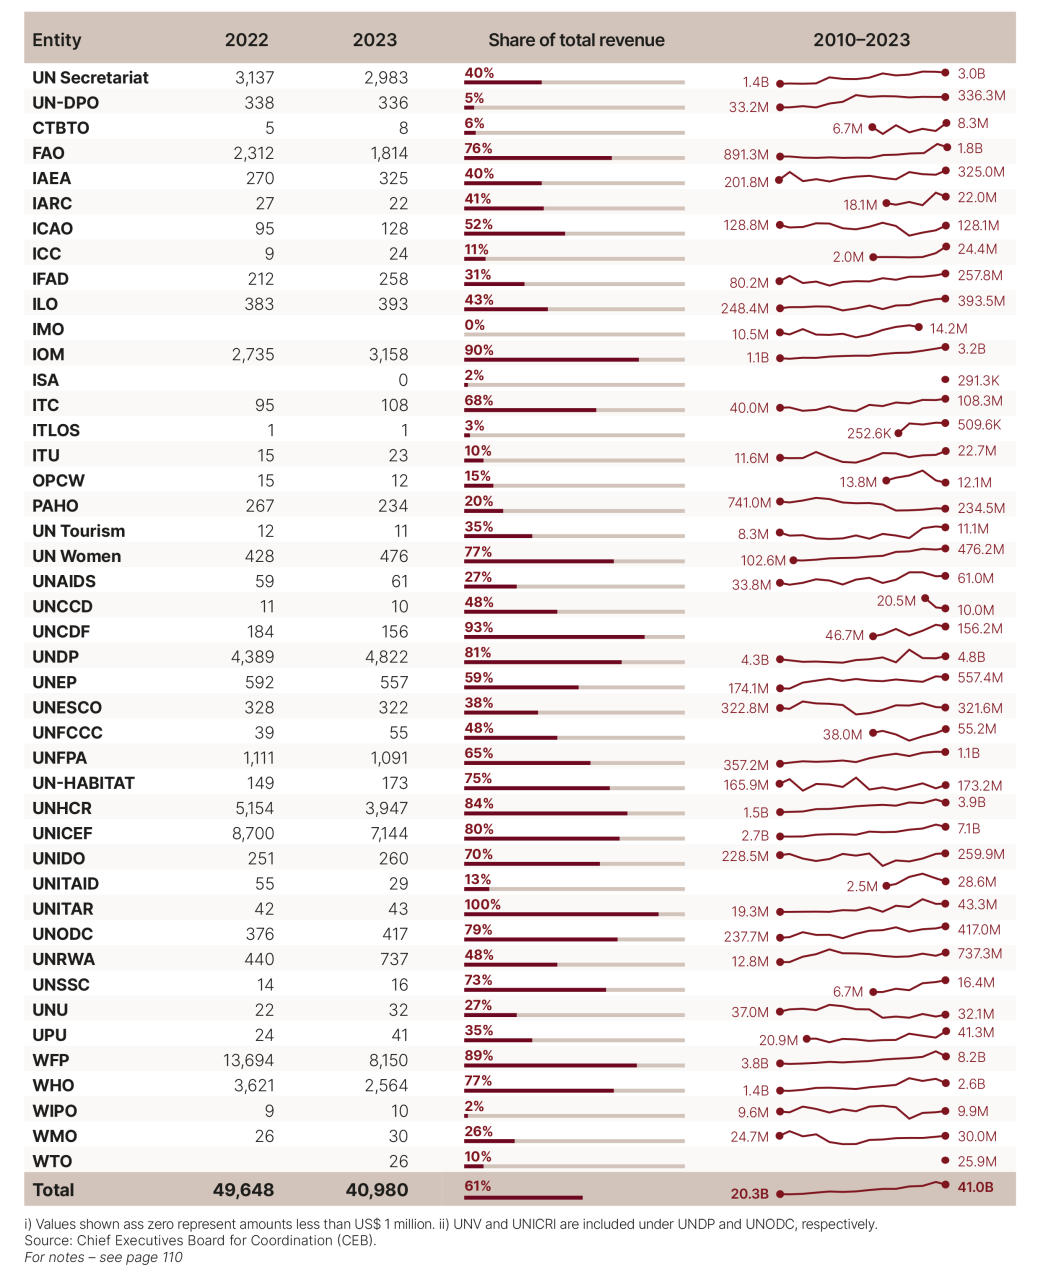
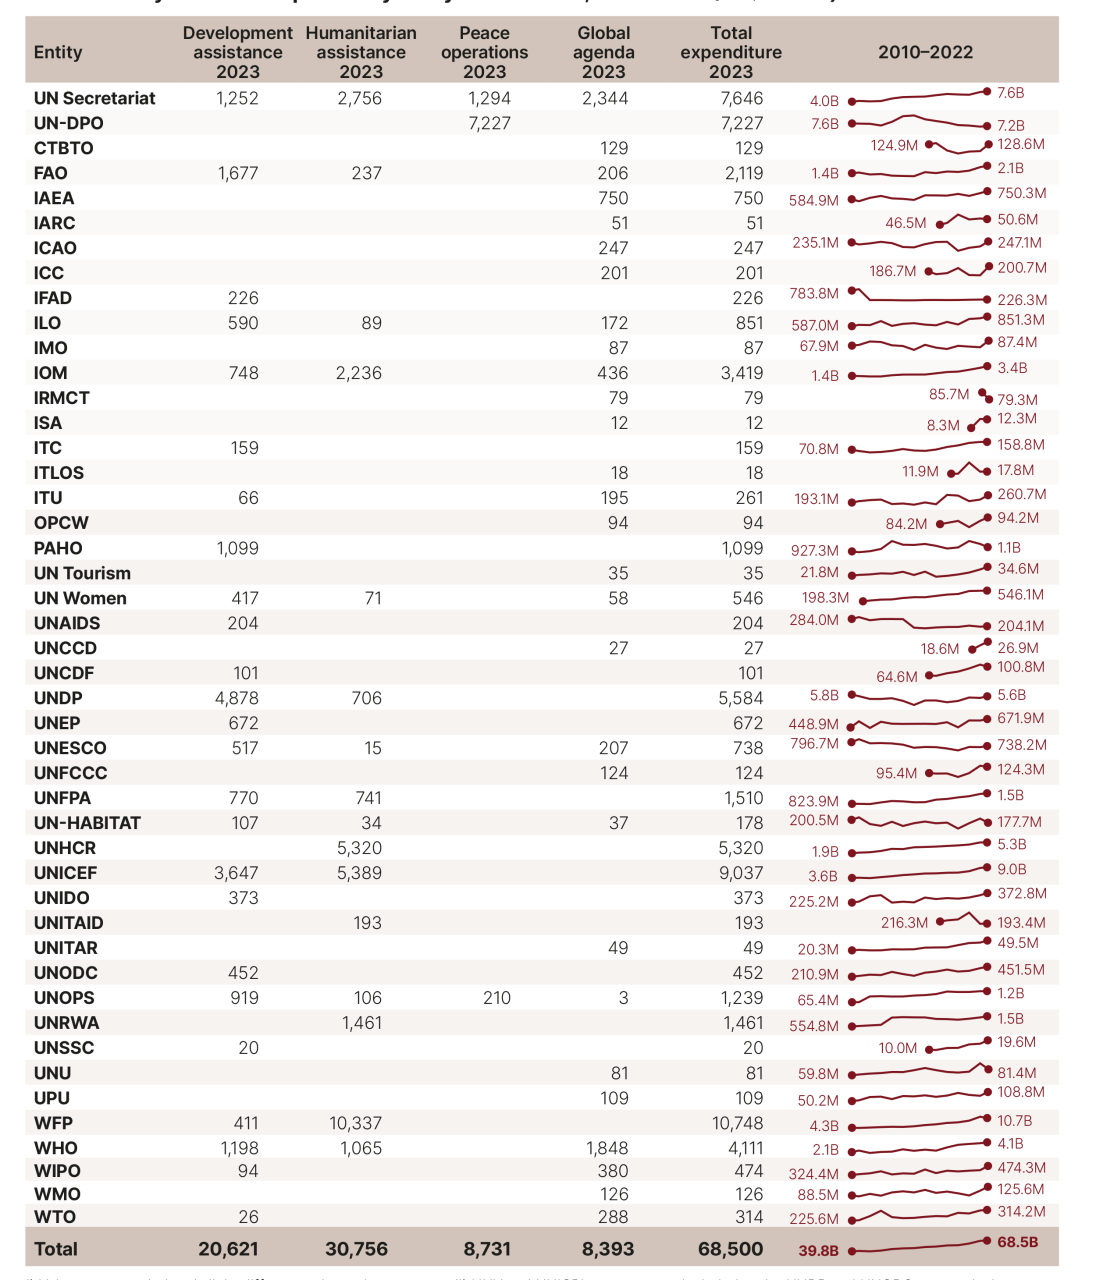
Navigating the intricate world of UN financing data can be a challenging task. To make this easier, we've curated a set of interactive data visualizations. These tools, elaborated using official data sources, transform the raw data into visual narratives. This allows users to explore and extract insights from the data.


