Visualisation
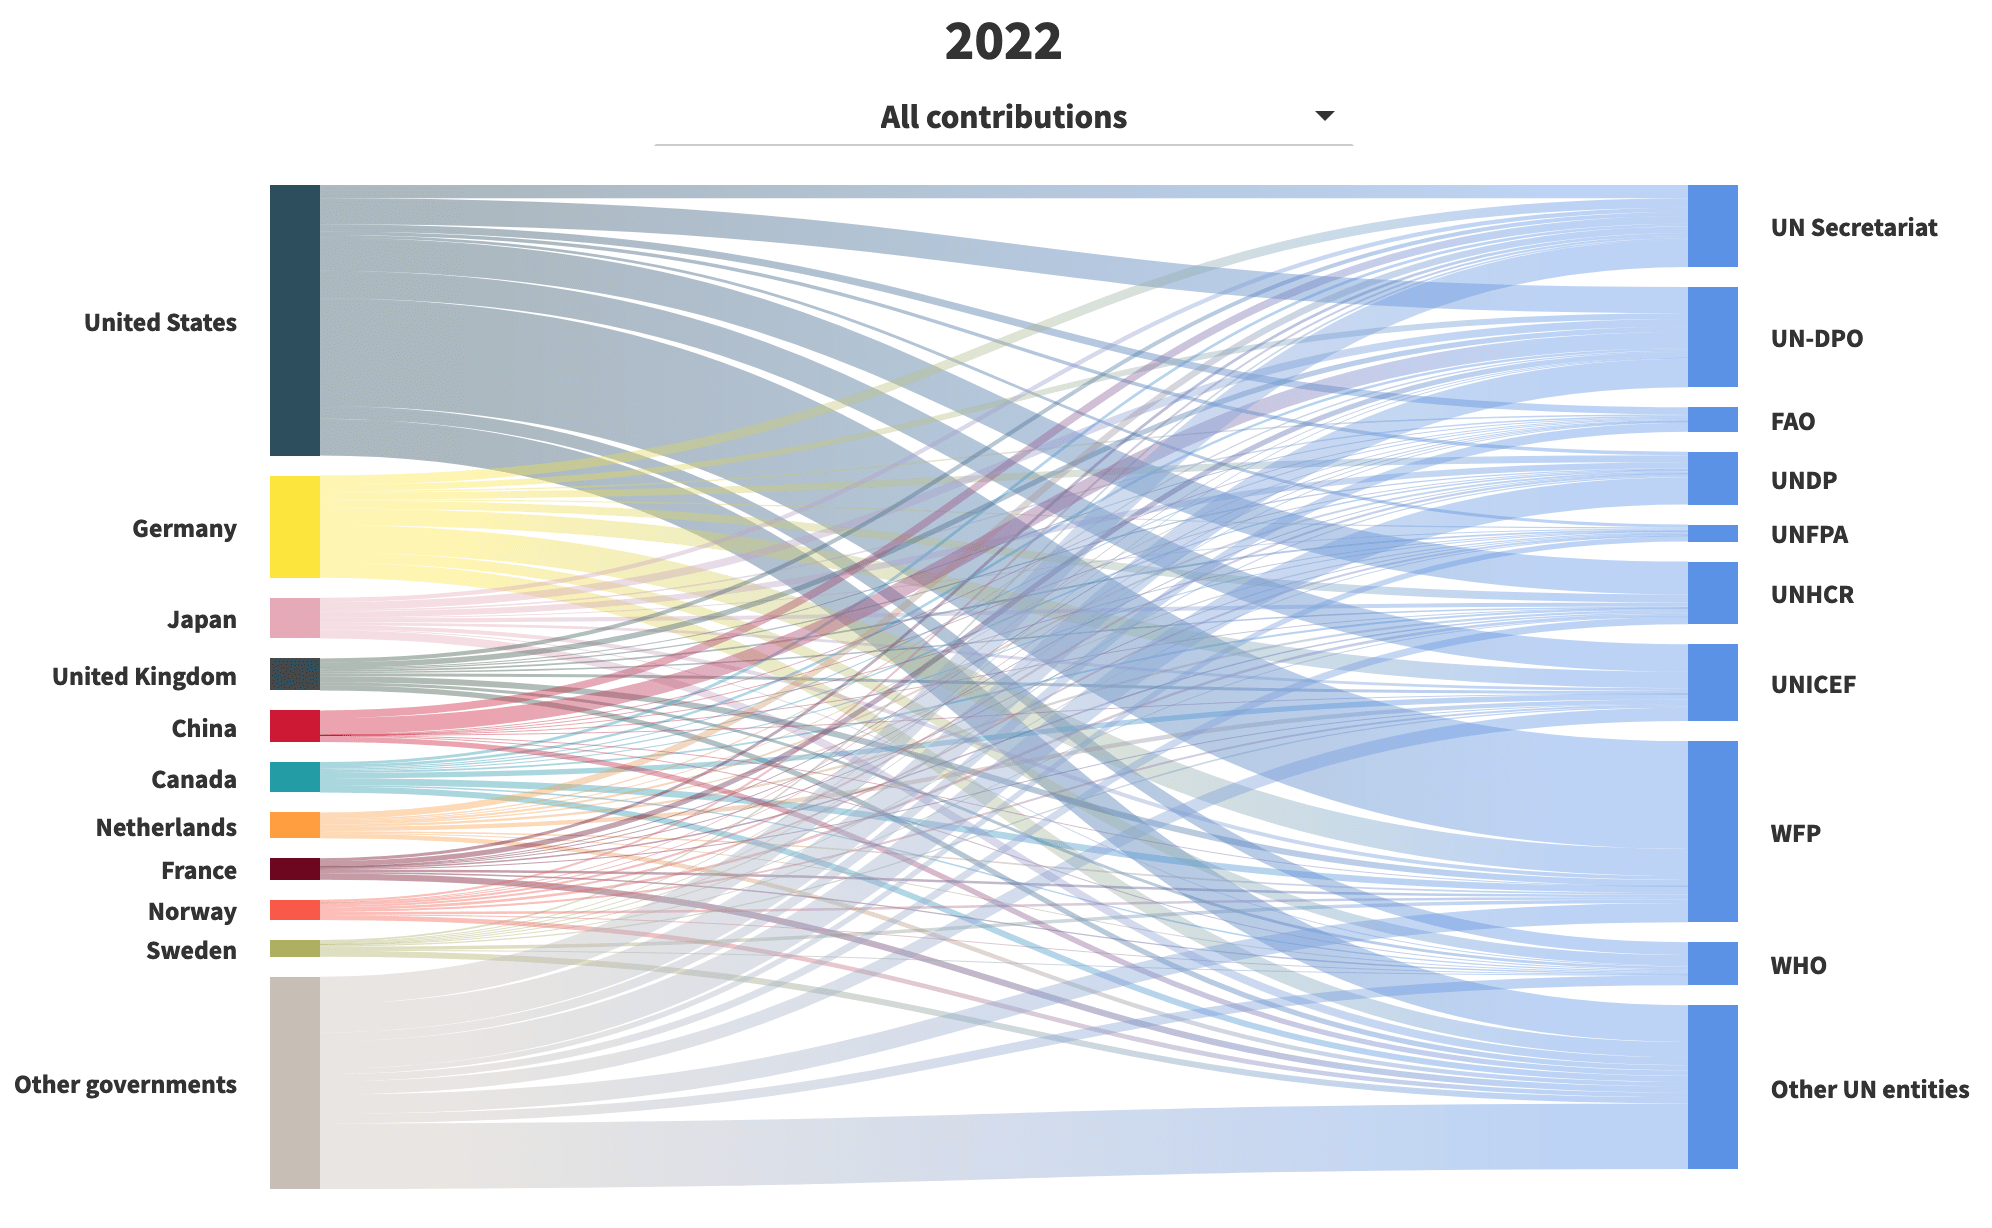
Flows from top contributing countries to UN entities, 2010-2022 (US$ million)
Download
Image
Source:
Source: Chief Executives Board for Coordination (CEB)
- < previous
- all
- next >
- 18 of 202