Having presented the core functions used to categorise UN system expenses – development assistance, humanitarian assistance, peace operations, and global agenda and specialised assistance – we now turn to expenses by UN entity and function. Table 4 provides an overview of total expenses in 2023 for each UN entity, along with how these expenses are distributed across the four functions. In addition, sparklines illustrate the evolution of each entity’s total expenses since 2010 (or, where applicable, the year the entity began reporting to the CEB). As expected, there is a clear alignment between an entity’s institutional mandate and which function its expenses are concentrated in.
As shown in Figure 27 and reflected in Table 4, humanitarian assistance accounted for US$ 30.8 billion in 2023, representing 45% of total UN system expenses. Three entities together accounted for more than two-thirds of these expenses: WFP (34%), UNICEF (18%) and UNHCR (17%). By contrast, development assistance expenses – which amounted to US$ 20.6 billion, or 30% of overall UN system expenses – were far less concentrated, with half attributable to the development expenses of UNDP (24%), UNICEF (18%) and FAO (8%). Peace operations were heavily concentrated in two entities: UN-DPO (83%) and the UN Secretariat (15%). Finally, expenses under global agenda and specialised assistance totalled US$ 8.4 billion, with the UN Secretariat (28%) and WHO (22%) accounting for approximately half of this amount.
It should come as no surprise that the three UN entities with the highest levels of revenue in 2023 also recorded the highest levels of expenses. WFP led with US$ 10.7 billion, of which 96% was allocated to humanitarian assistance, followed by UNICEF with US$ 9.0 billion, reflecting significant expenses in both development (40%) and humanitarian functions (60%). The UN Secretariat ranked third, with US$ 7.6 billion in expenses spread across a diverse functional profile: 36% for humanitarian assistance, 31% for global agenda and specialised assistance, 17% for peace operations, and 16% for development.62
For many UN entities, their expense profile reflected a predominant function closely aligned with their core mandate. For instance, UN-DPO allocated its entire budget to peace operations; WFP focused exclusively on humanitarian assistance, as did UNHCR to a near-complete extent; the International Atomic Energy Agency (IAEA) directed all its resources to the global agenda function; while PAHO and UNDP allocated all and most of their budgets, respectively, to development assistance.
Preliminary 2024 UN expense data
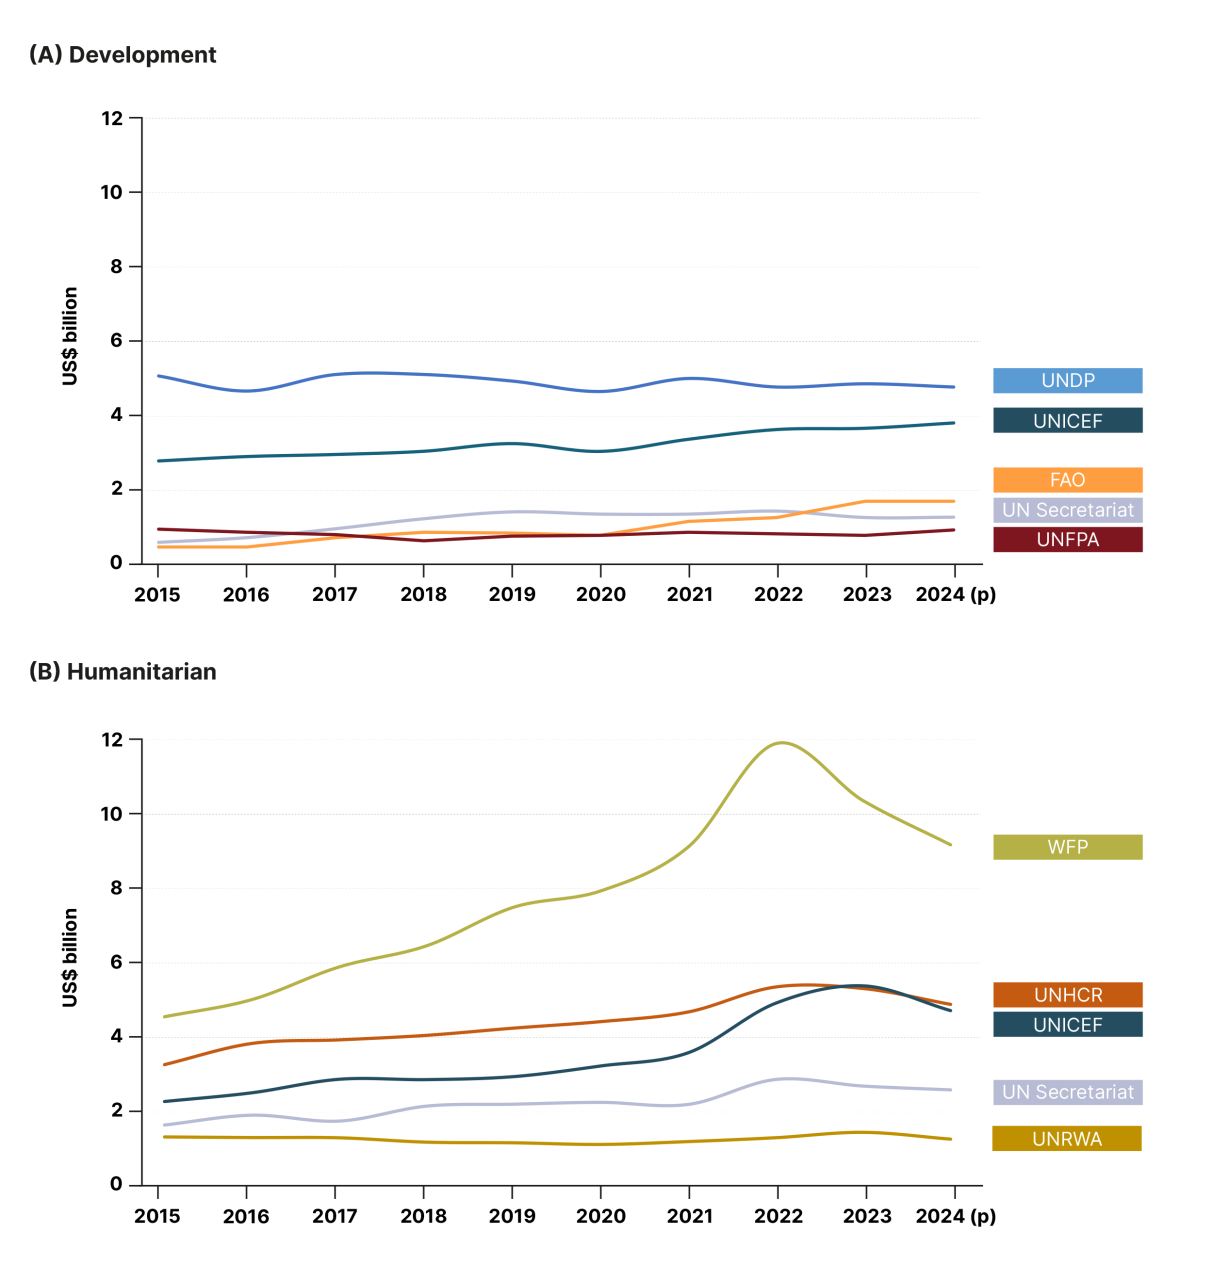
Despite the challenging context, UN entities remained committed to their mission of delivering results where they are needed the most – often operating under extremely difficult conditions. Figure 29 presents the expense trends for development and humanitarian assistance for selected UN entities from 2015 to 2024. It is the only figure in Chapter 2 that includes preliminary 2024 expense data, which was subject to verification at the time this report was prepared. The figure is divided into two panels allowing comparison of the scale and trajectory of spending between the two operational functions. Both the UN Secretariat and UNICEF have a significant presence in both UN development and humanitarian assistance, reflecting the breadth of their mandates.
Panel A presents the annual development assistance expenses of FAO, UN Secretariat, UNDP, UNICEF and UNFPA. FAO experienced the strongest relative growth, more than tripling its expenses from US$ 0.5 billion in 2015 to US$ 1.7 billion in 2024. This reflects the active use of resources to combat food insecurity and malnutrition and to support the transition towards climate resilient, low-emission agrifood systems.63 UNDP consistently recorded the highest level of expenses among the group, maintaining a stable operational scale with spending fluctuating from US$ 4.6 billion to 5.1 billion. UNICEF showed a steady and gradual increase in expenses, rising from US$ 2.8 billion in 2015 to US$ 3.8 billion in 2024. The UN Secretariat’s expenses in development assistance grew from US$ 583 million to US$ 1.4 billion in 2019. From 2020 onward, expenses plateaued, before declining modestly in 2023 and 2024. UNFPA’s expenses remained relatively flat, with only marginal growth over the period.
Panel B shows the annual humanitarian assistance expenses of the UN Secretariat, UNHCR, UNICEF, UNRWA and WFP. It highlights significant disparities in both scale and growth patterns, reflecting differing mandates, operational reach, and the level of resources available to address evolving humanitarian needs. Among these UN entities, WFP consistently registers the highest humanitarian expenses and has also experienced the largest expansion. Spending increased from US$ 4.6 billion in 2015 to US$ 9.2 billion in 2024, with 2022 seeing a peak at US$ 11.9 billion, reflecting the surge in global food insecurity and WFP’s role in large-scale emergency responses. By contrast, UNRWA exhibits a flat trend and of the UN entities depicted is the only one with lower level of expenses in 2024 than in 2015, consistent with funding suspensions or pauses despite unprecedented needs among refugees from, and those displaced within, the State of Palestine.
Total expenses for development and humanitarian assistance by select UN entities, 2015–2024 (US$ billion)
Source: Chief Executives Board for Coordination (CEB).
Note: Data based on information reported to the CEB in accordance with IPSAS and therefore reflects the full value of expenses when they are incurred, not when cash is paid. The 2024 data, submitted through the 2025 CEB reporting exercise, is preliminary.