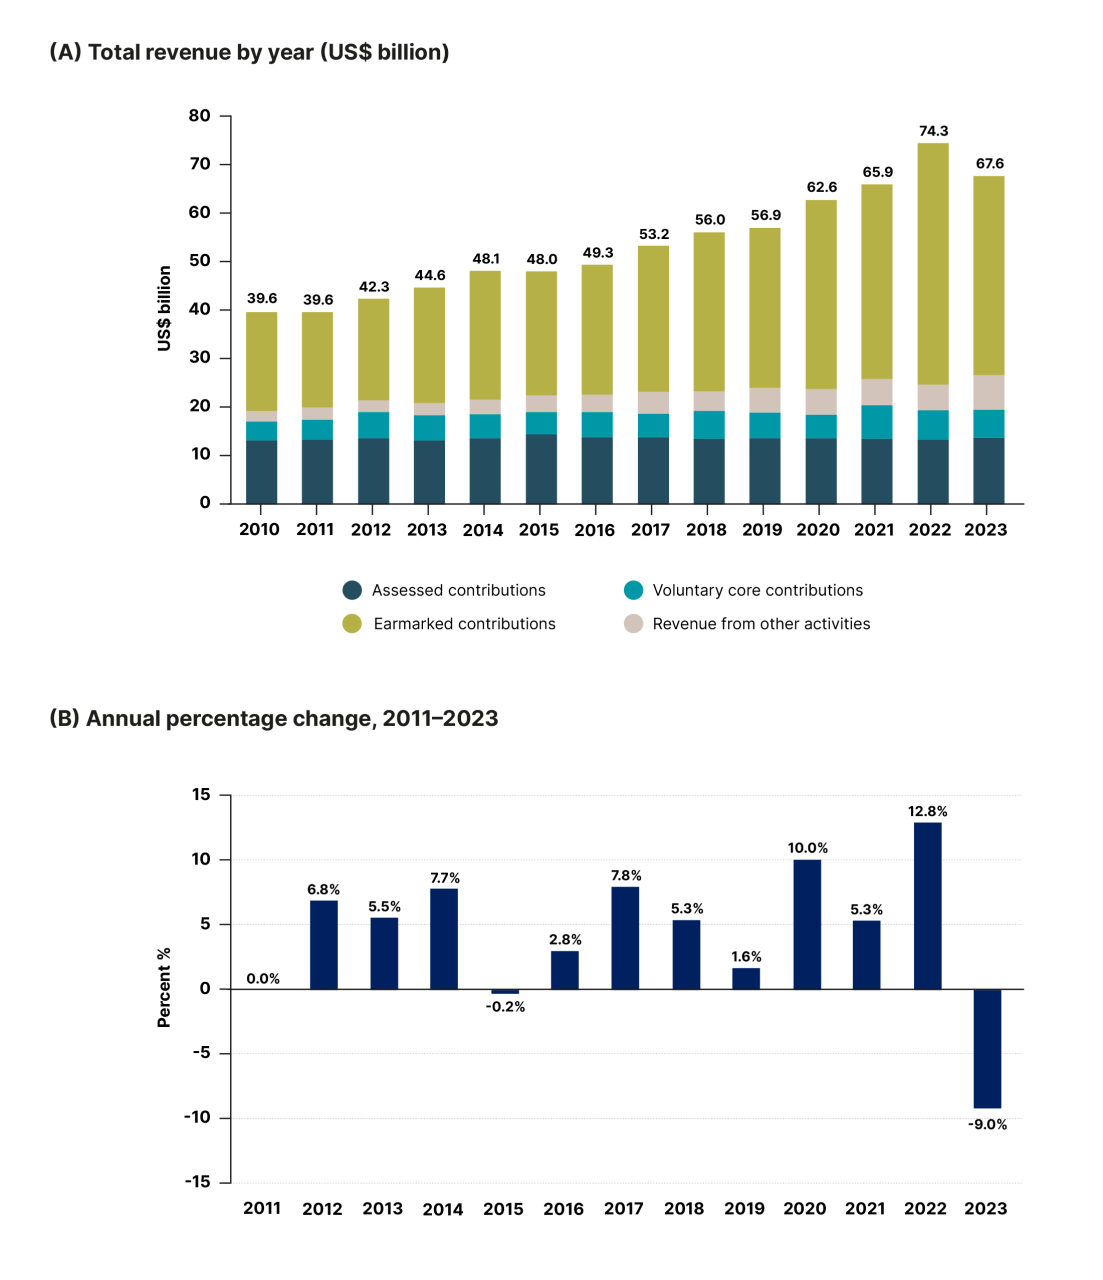
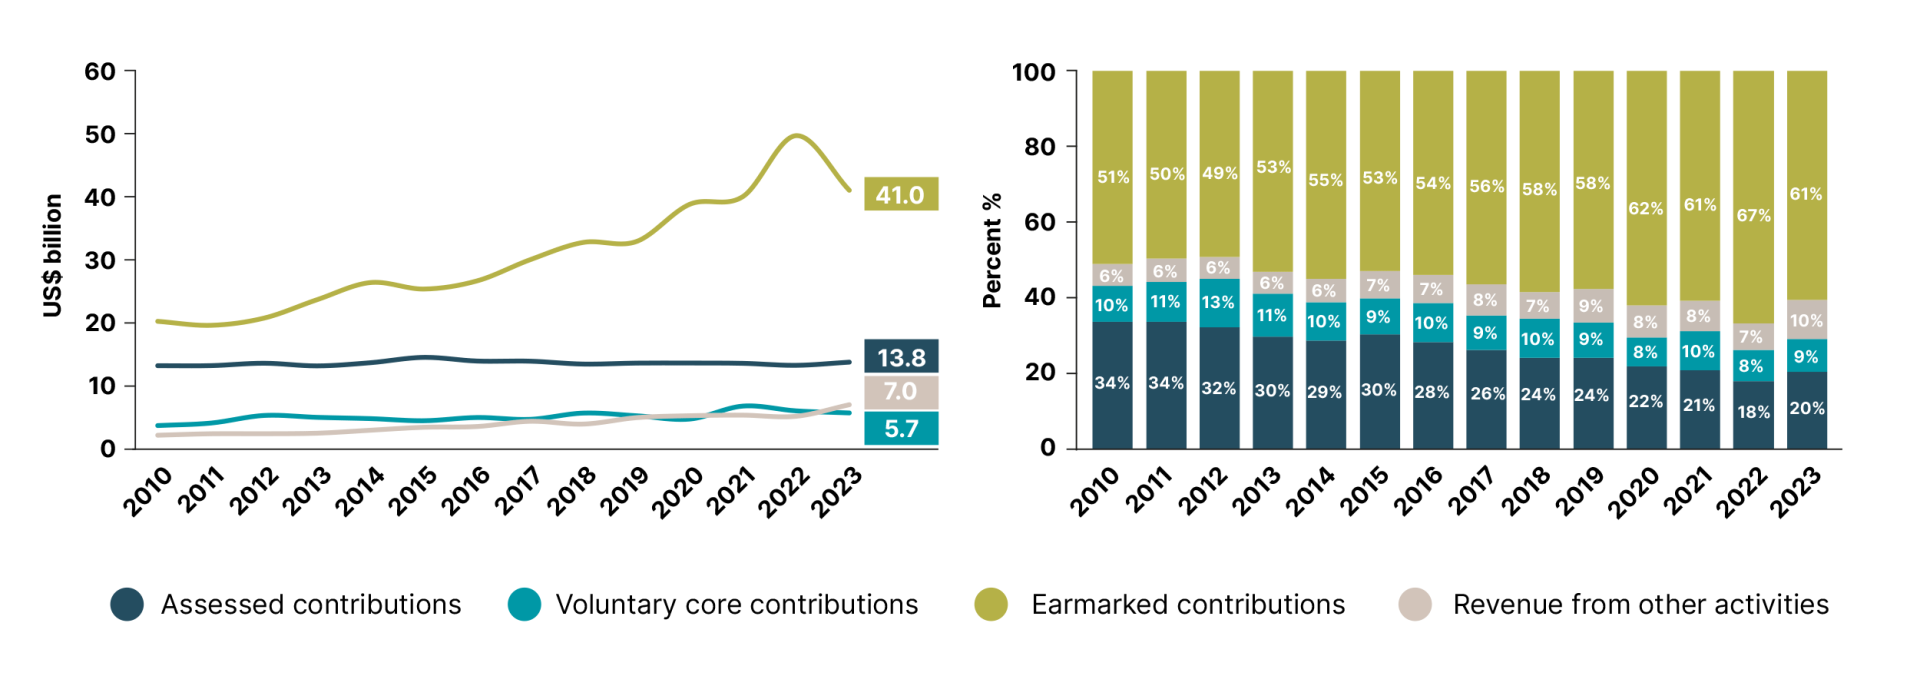
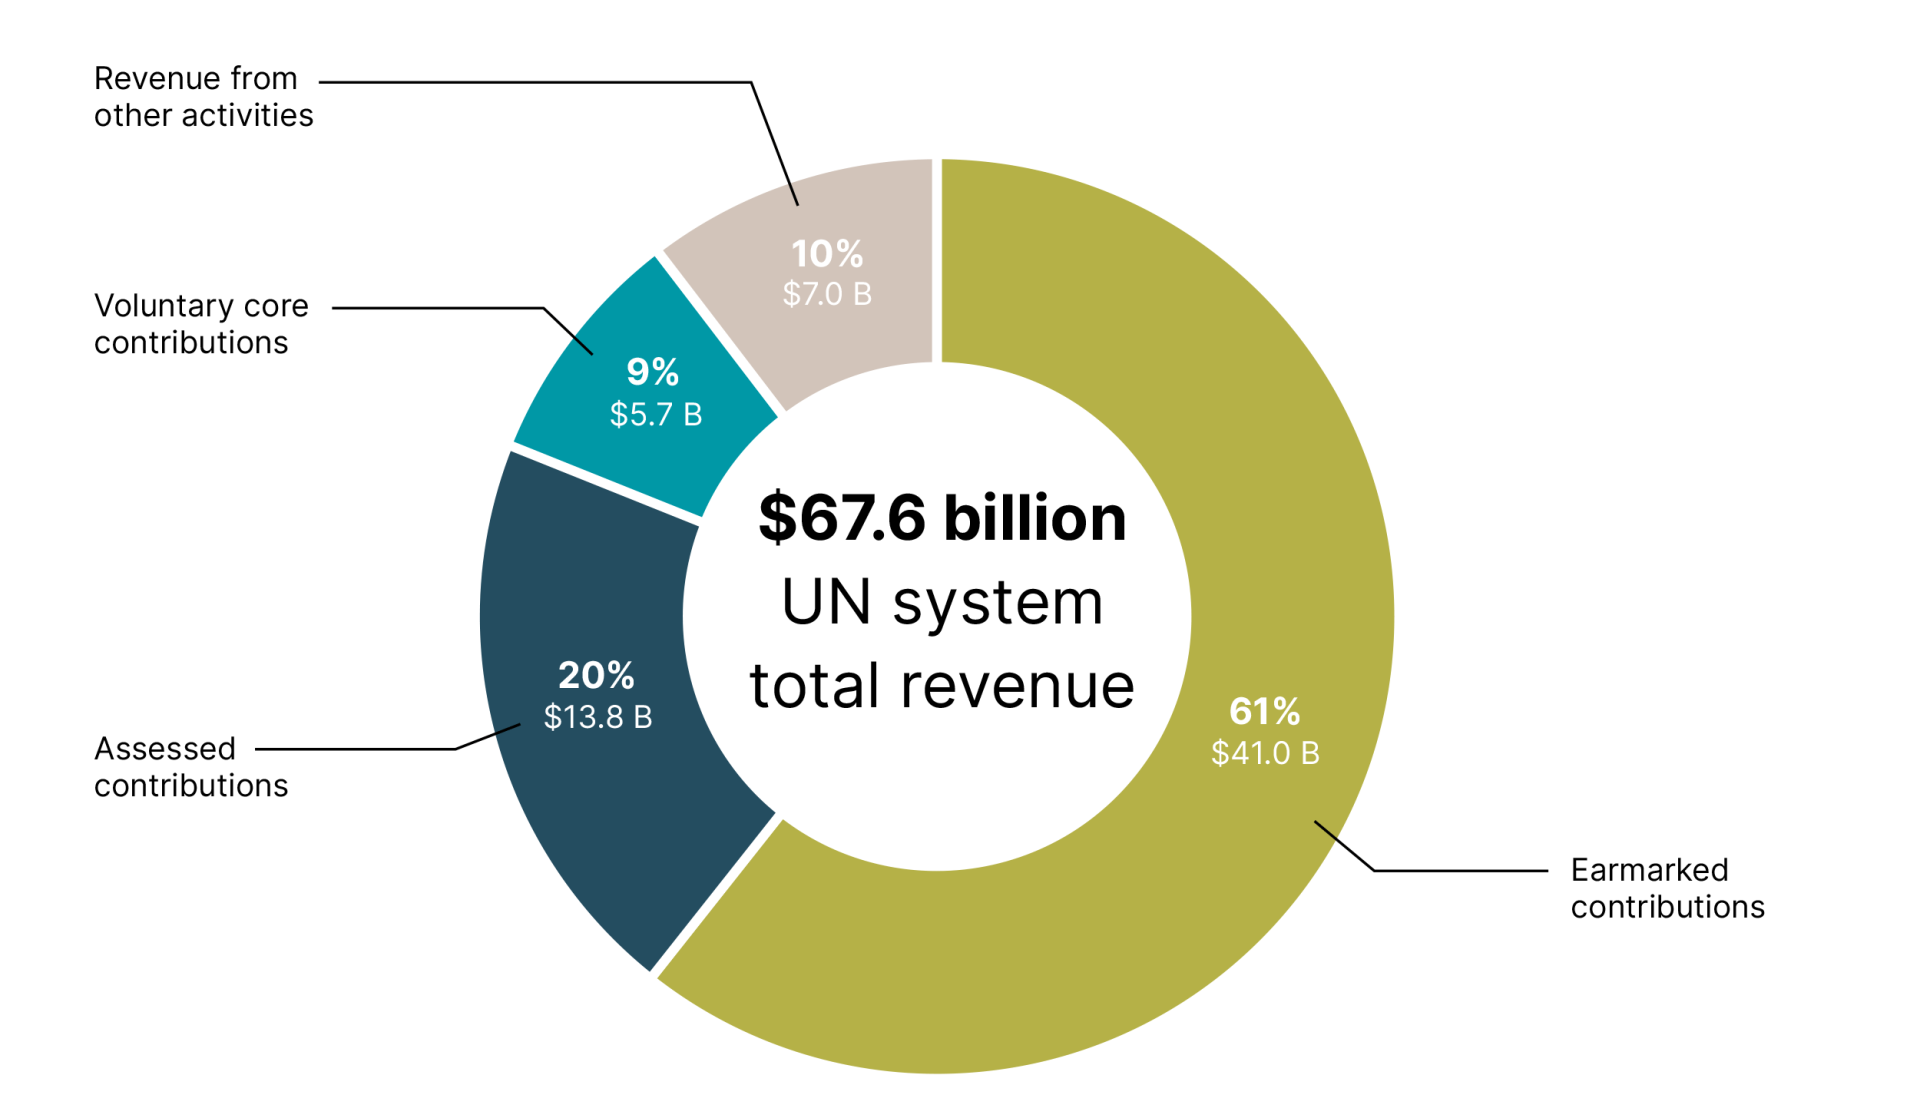
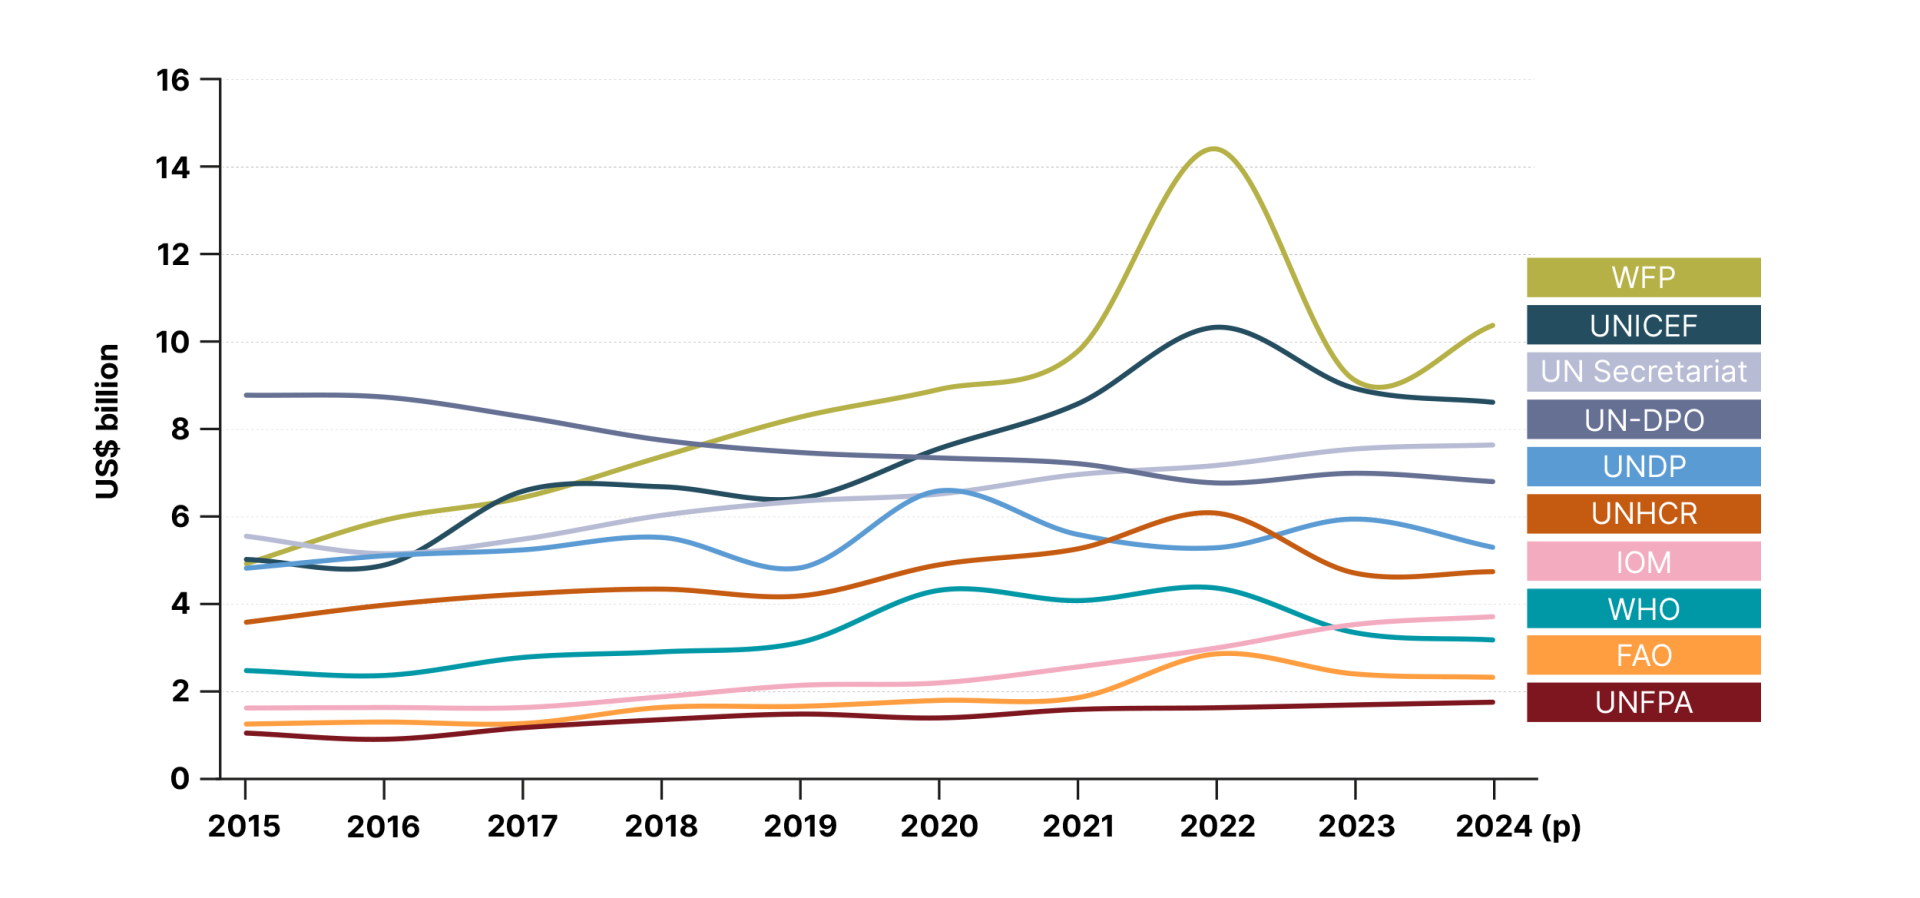
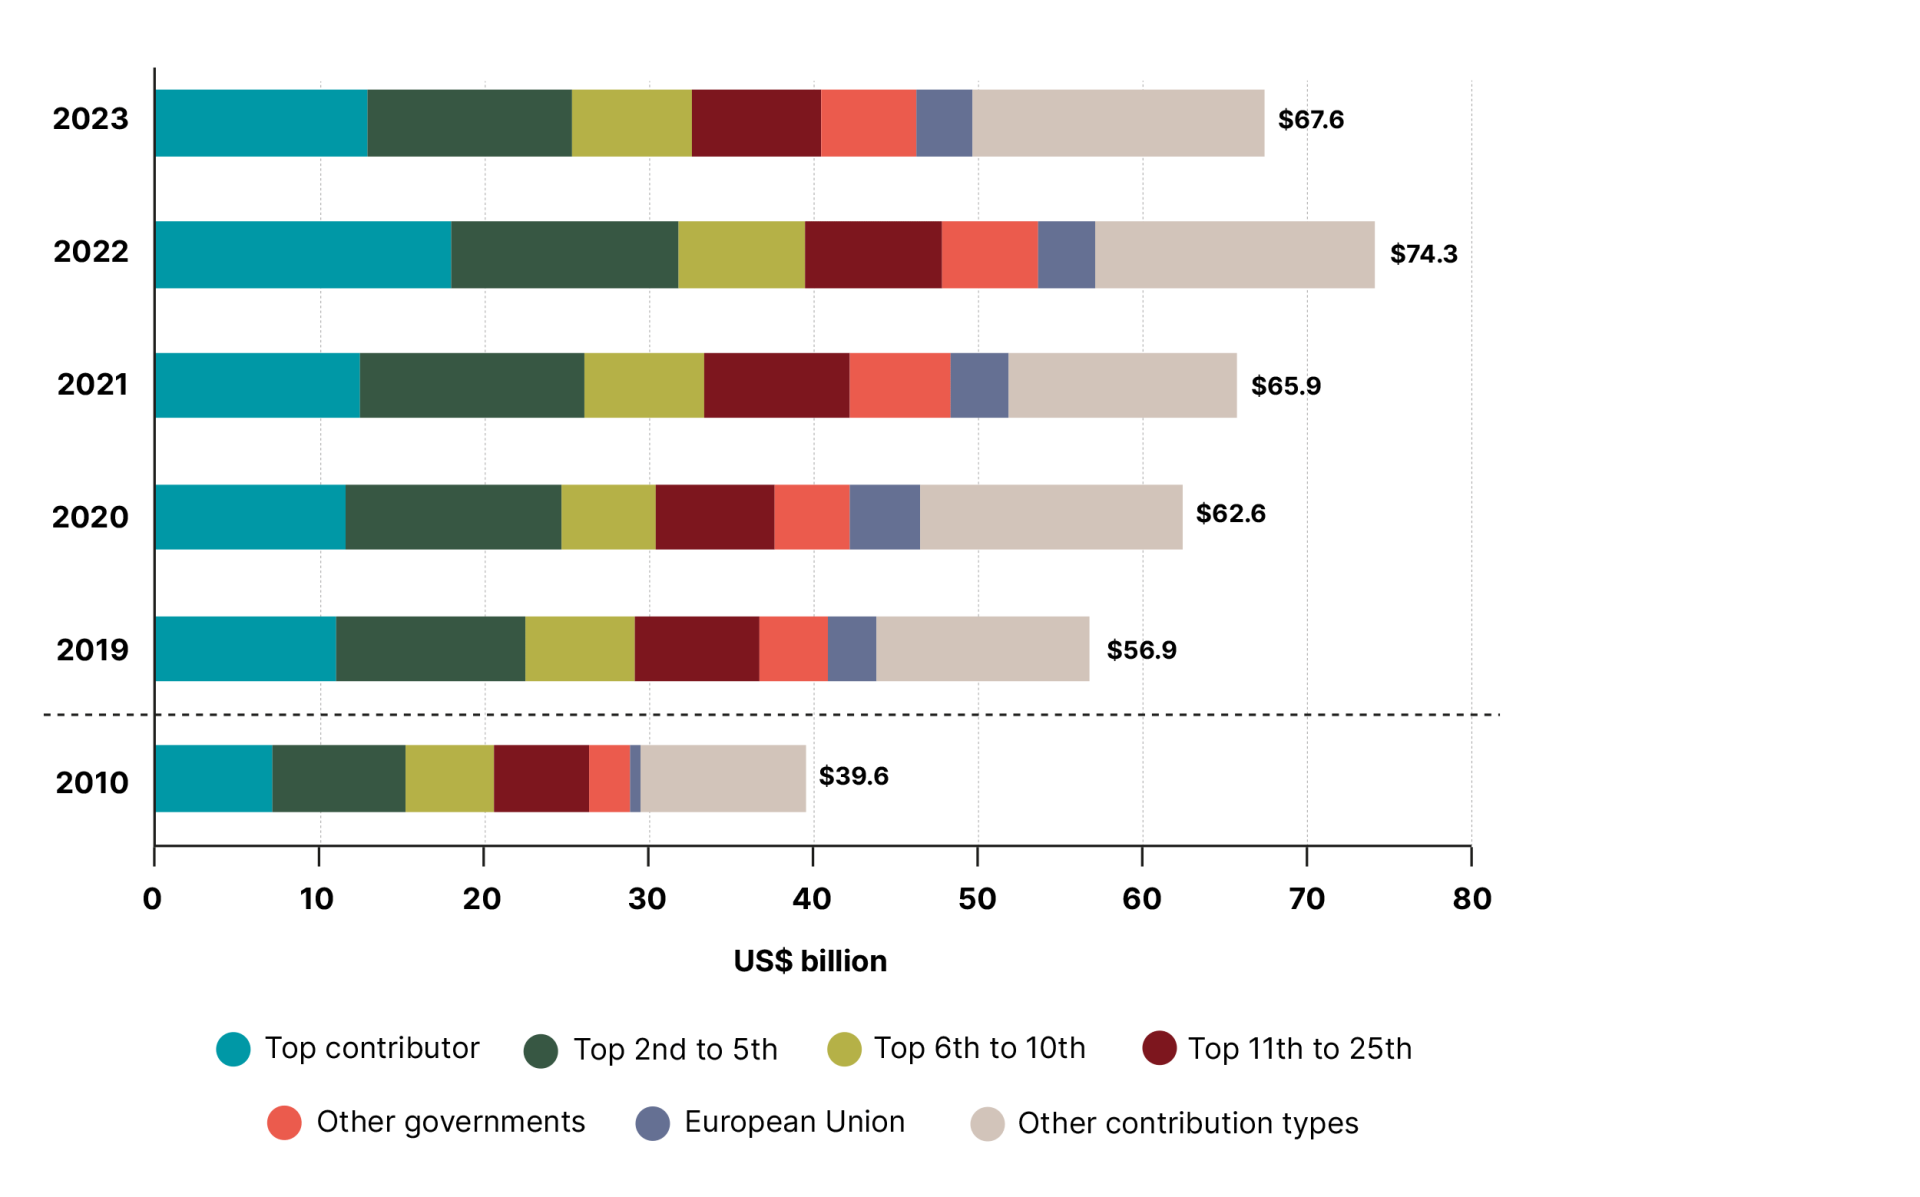
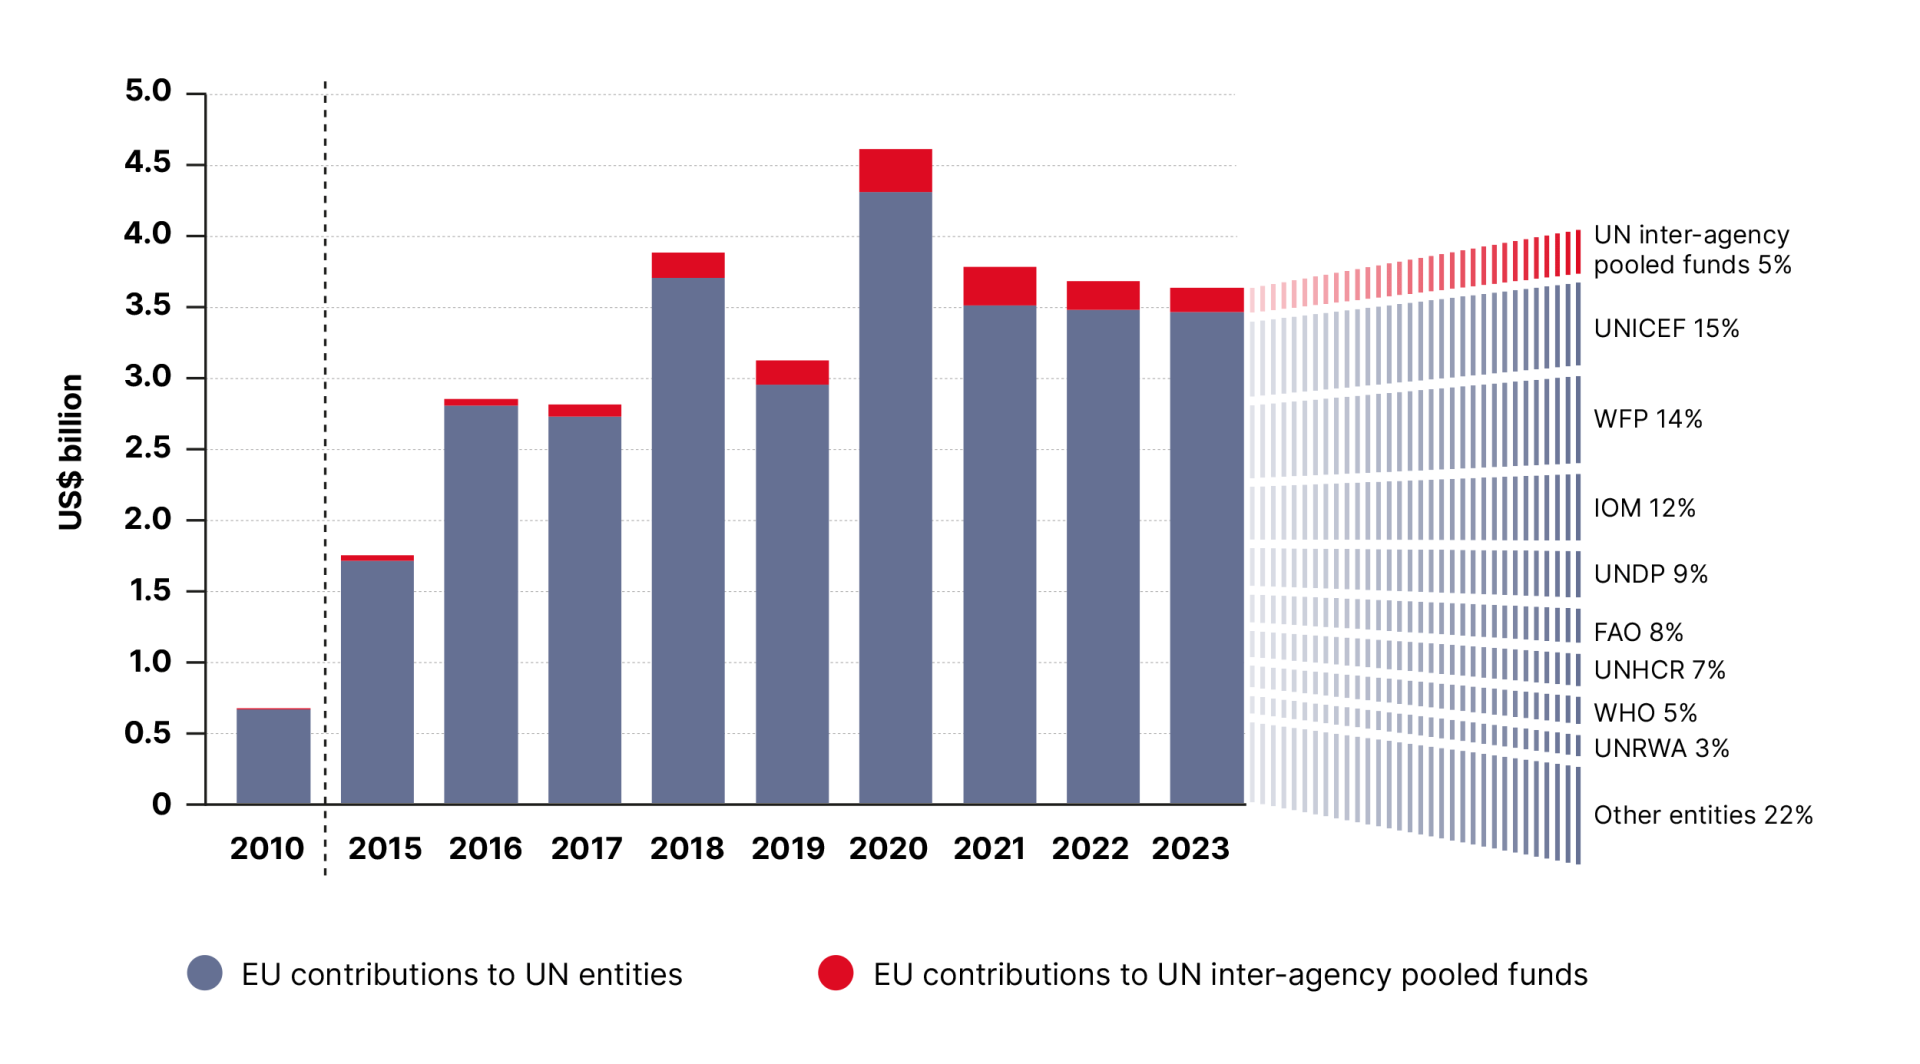
Explore the data Figures and tables Taking data quality to the next level Filter Year20252024202320222021 Figure 1 Funding of the UN system, 2010-2023 Figure 2 Distribution of UN system funding by financing instrument, 2010–2023 (US$ billion) Figure 3 UN system funding, 2010–2023: Nominal values at current prices and real values at constant 2022 prices (US$ billion) Figure 4 Funding of the UN system by financing instrument, 2023 (US$ billion) Table 1 UN system total revenue by entity and financing instrument, 2010–2023 (US$ million) Table 2 Assessed contributions to the UN system by entity, 2010-2023 (US$ million) Table 3 Earmarked contributions to the UN system by entity, 2010–2023 (US$ million) Figure 5 Earmarked contributions to the UN system by type, 2018–2023 (percentage share of total earmarked contributions) Figure 6 Total revenue of select UN entities, 2015–2024 (US$ billion) Figure 7 Funding sources for the UN system, 2023 Figure 8 UN system funding by Member States and other contributors, 2010–2023 (US$ billion) Figure 9 Top Member State contributors to the UN system, 2023 (US$ billion and percentage share of GNI) Figure 10 EU funding to the UN system, 2010–2023 (US$ billion) Figure 11 International Financial Institutions (IFIs) funding to six select UN entities, 2023 (US$ million) Figure 12 Other non-state funding to the UN system, 2018–2023 (US$ billion) Figure 13 Total core and earmarked contributions for UN development and humanitarian assistance, 2010–2023 (US$ billion) Figure 14 Funding composition for UN development and humanitarian assistance: Top OECD-DAC member state contributors, 2023 (US$ billion) Figure 15 Funding composition for development and humanitarian assistance: Top non-OECD-DAC member state contributors, 2023 (US$ million) Figure 16 Funding composition for UN development assistance: Top Member State contributors and the EU, 2023 (US$ million) Figure 17 Funding composition for UN humanitarian assistance: Top Member State contributors and the EU, 2023 (US$ million) Pagination Current page 1 Page 2 Page 3 Next page Next › Last page Last »
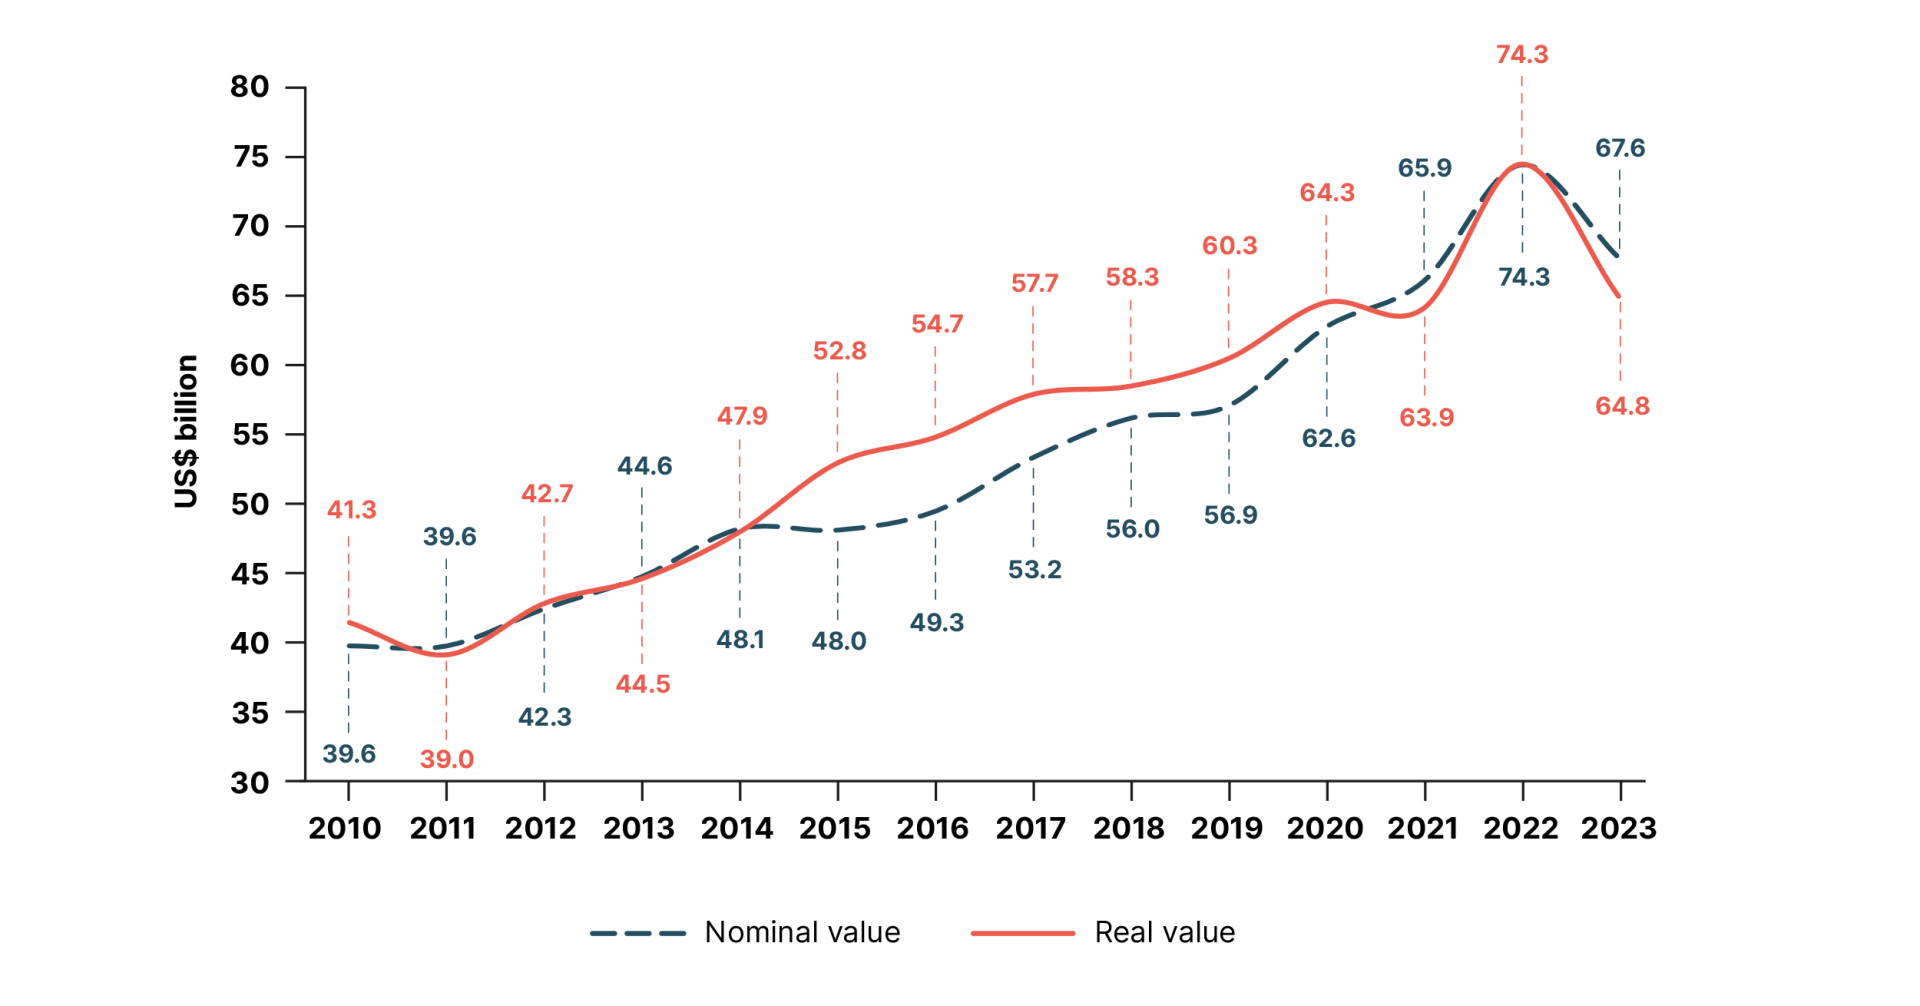
Figure 3 UN system funding, 2010–2023: Nominal values at current prices and real values at constant 2022 prices (US$ billion)
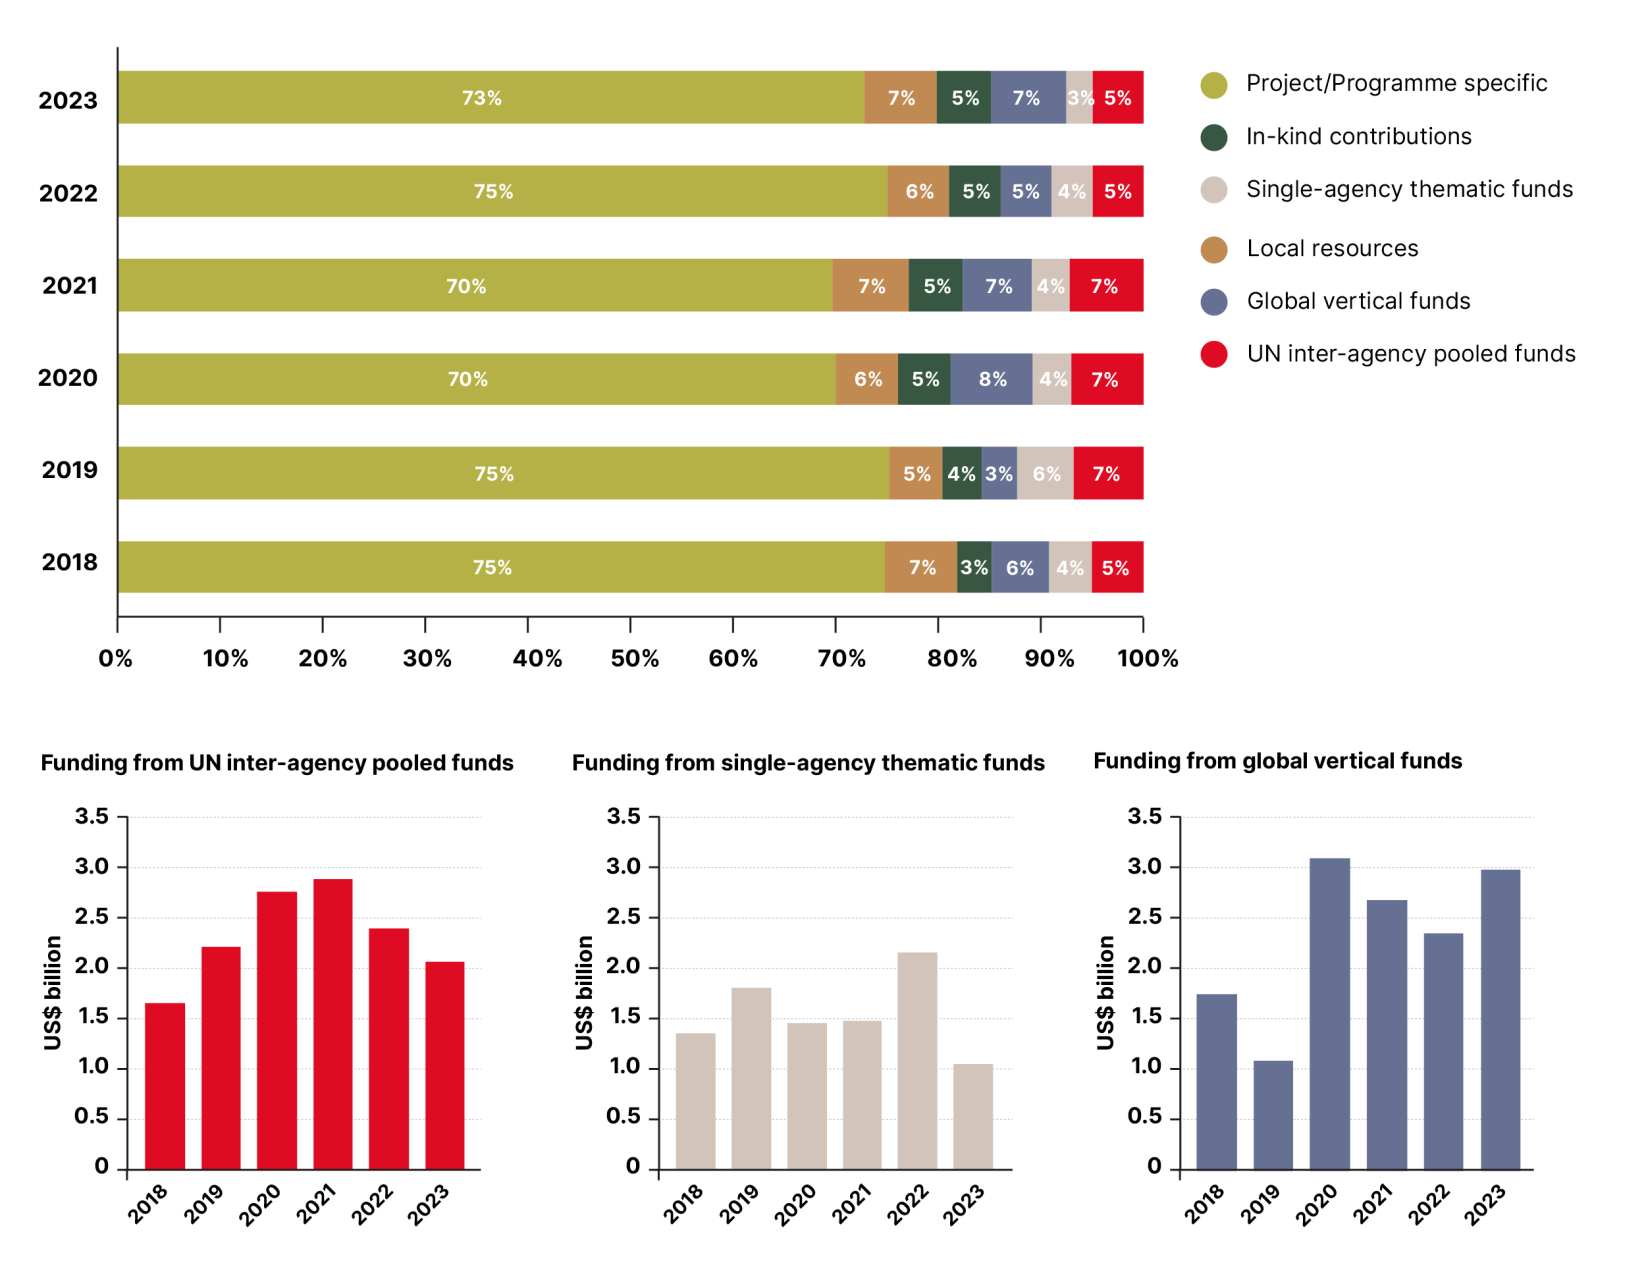
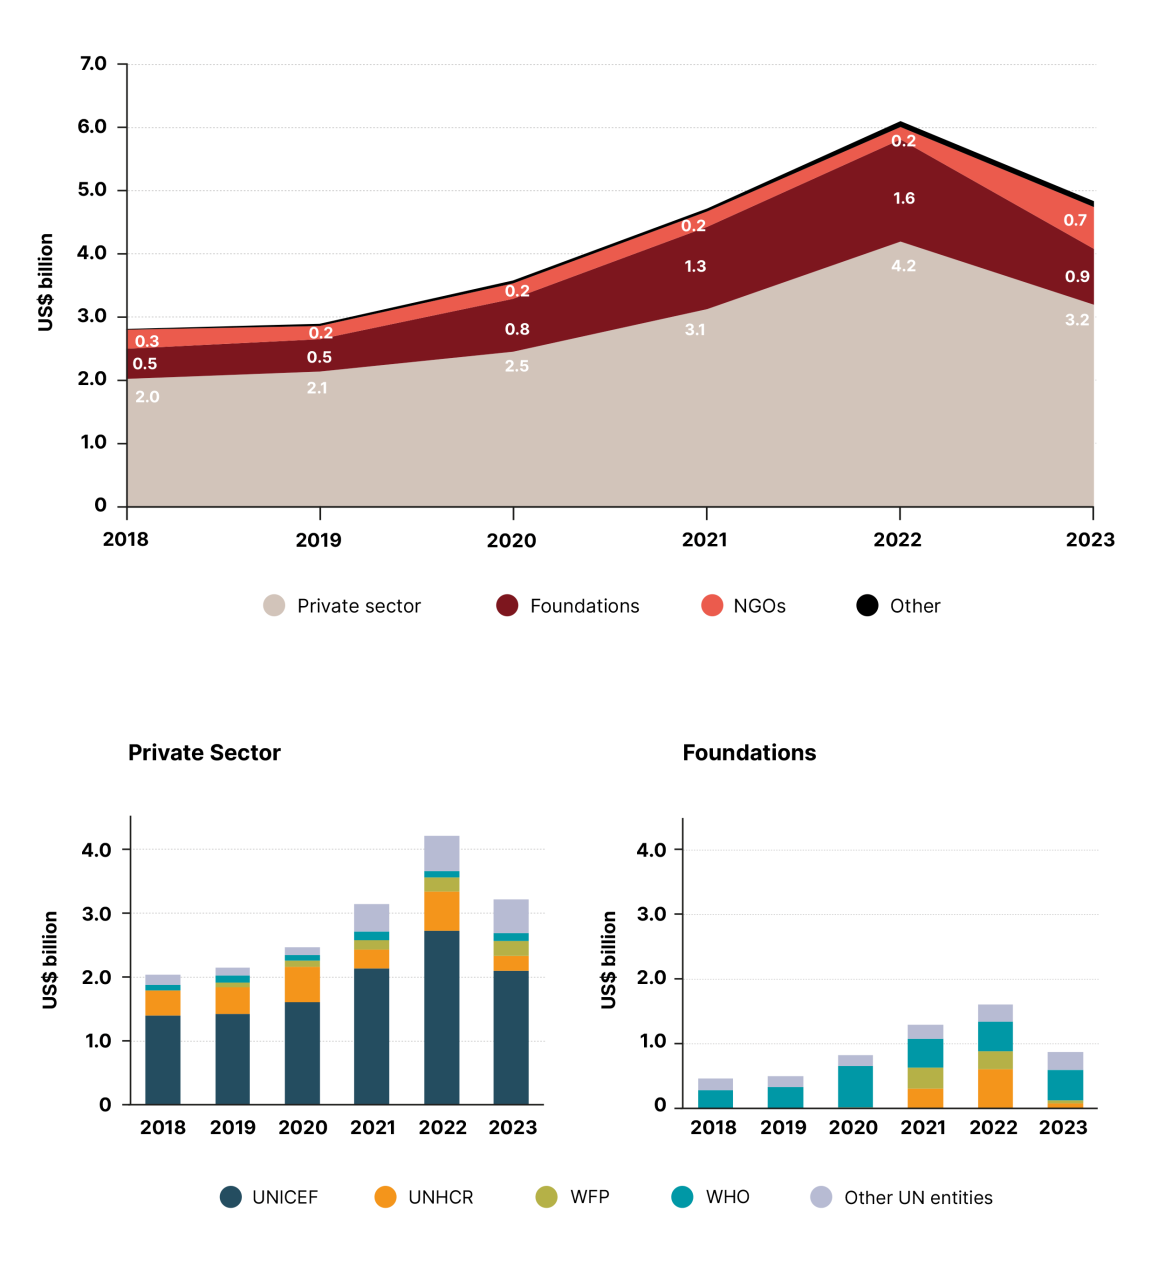
Figure 5 Earmarked contributions to the UN system by type, 2018–2023 (percentage share of total earmarked contributions)
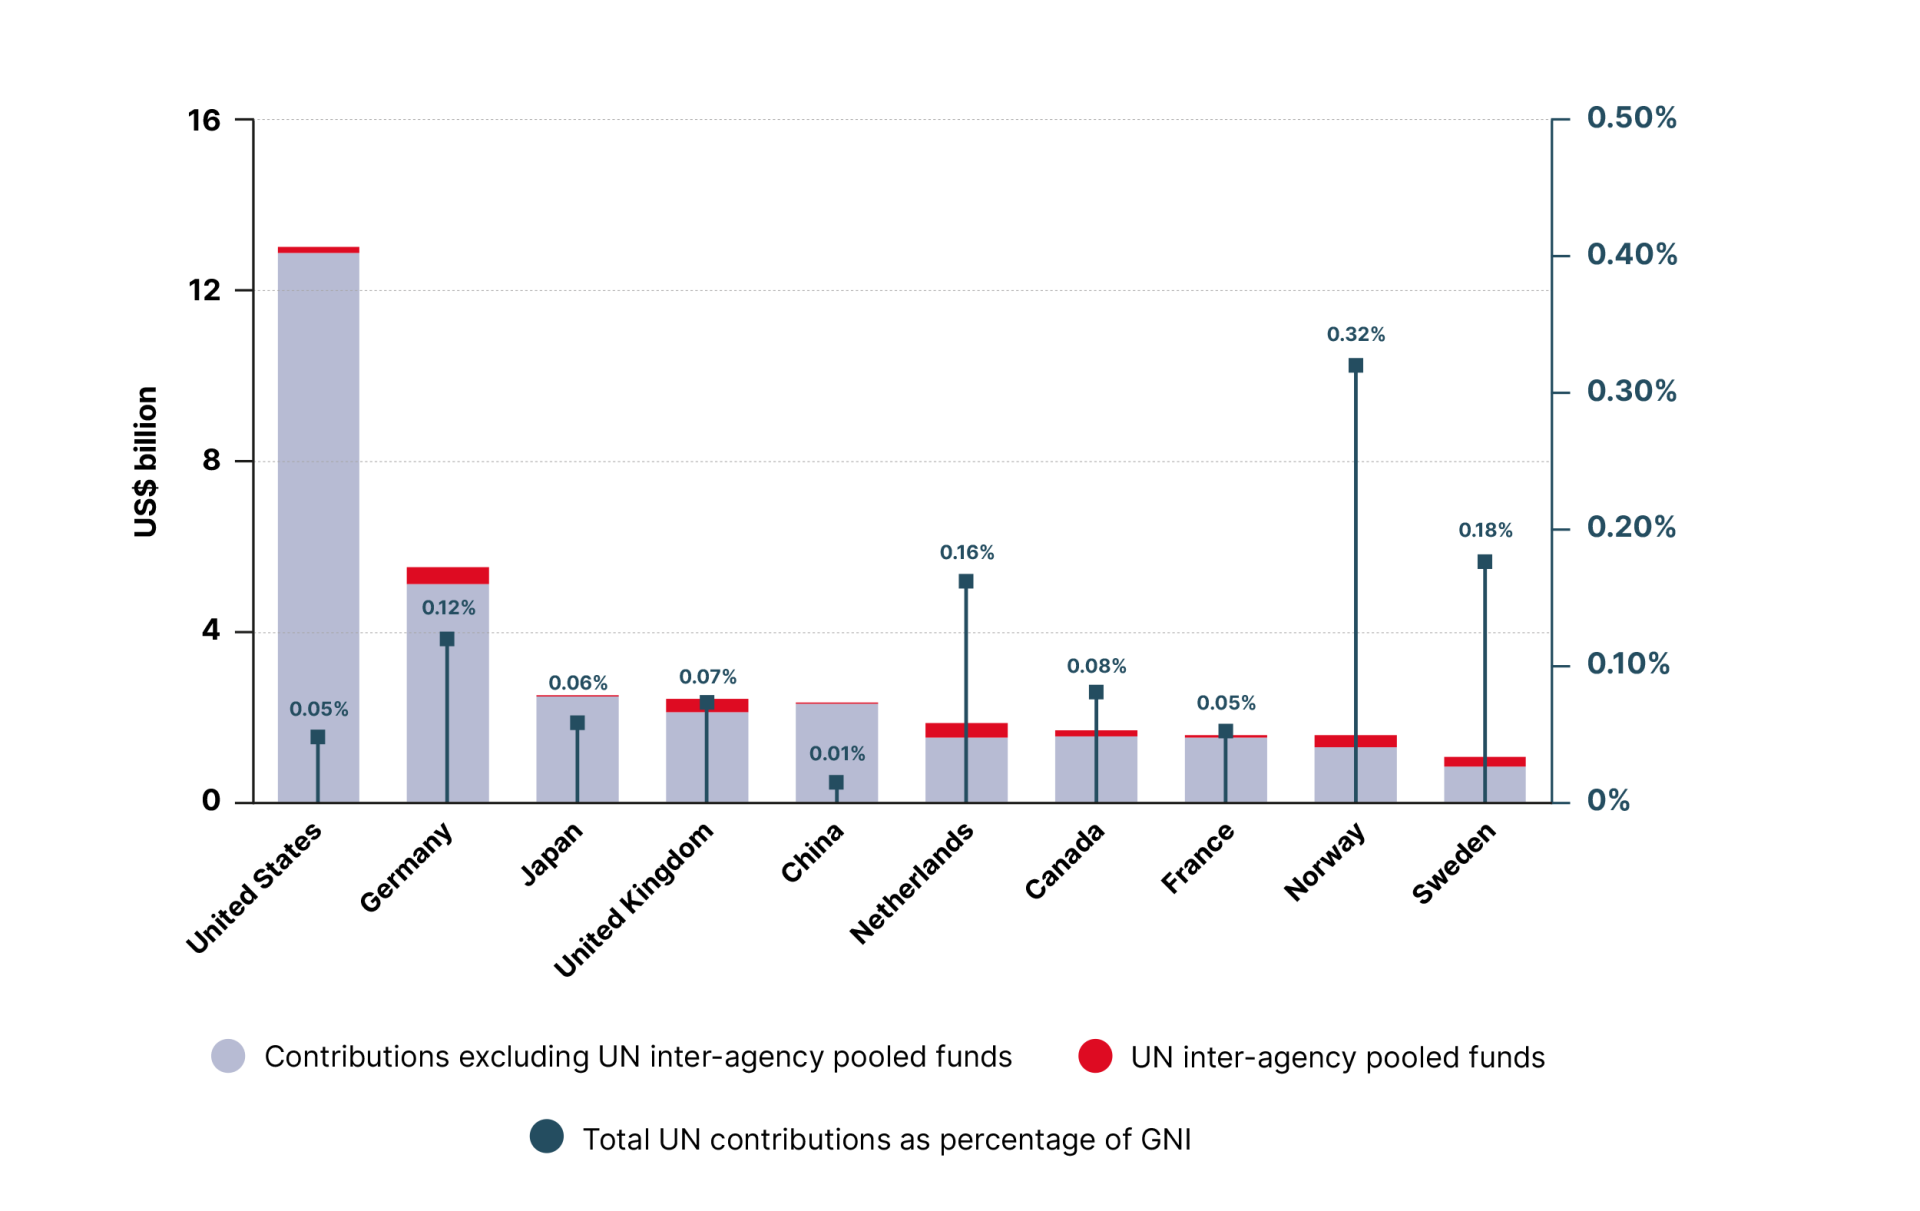
Figure 9 Top Member State contributors to the UN system, 2023 (US$ billion and percentage share of GNI)
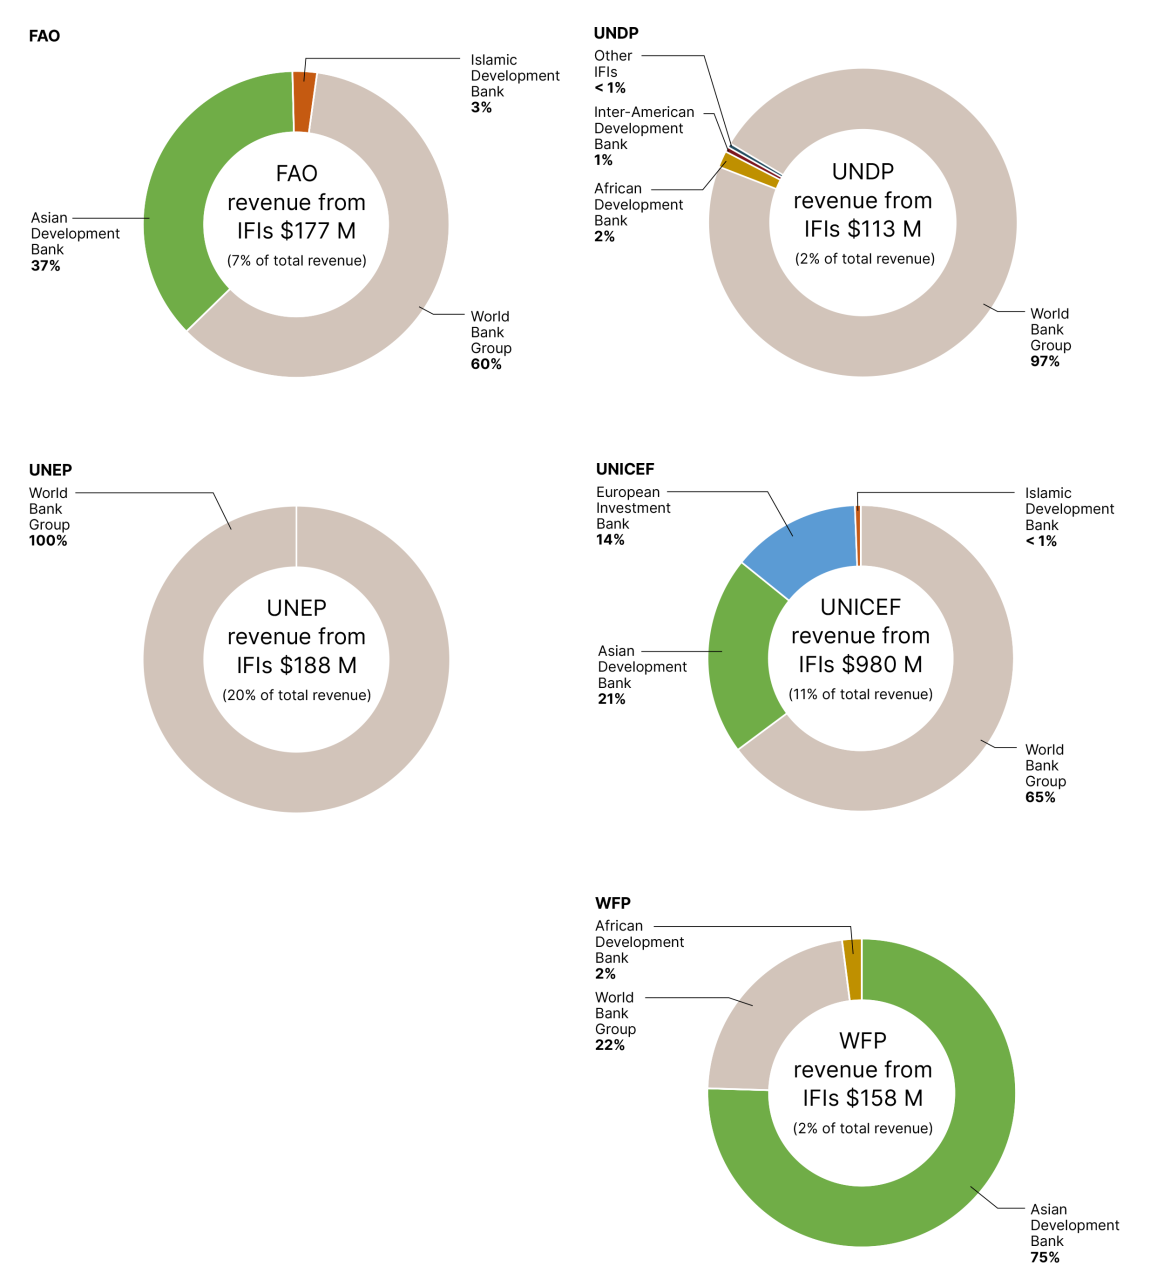
Figure 11 International Financial Institutions (IFIs) funding to six select UN entities, 2023 (US$ million)
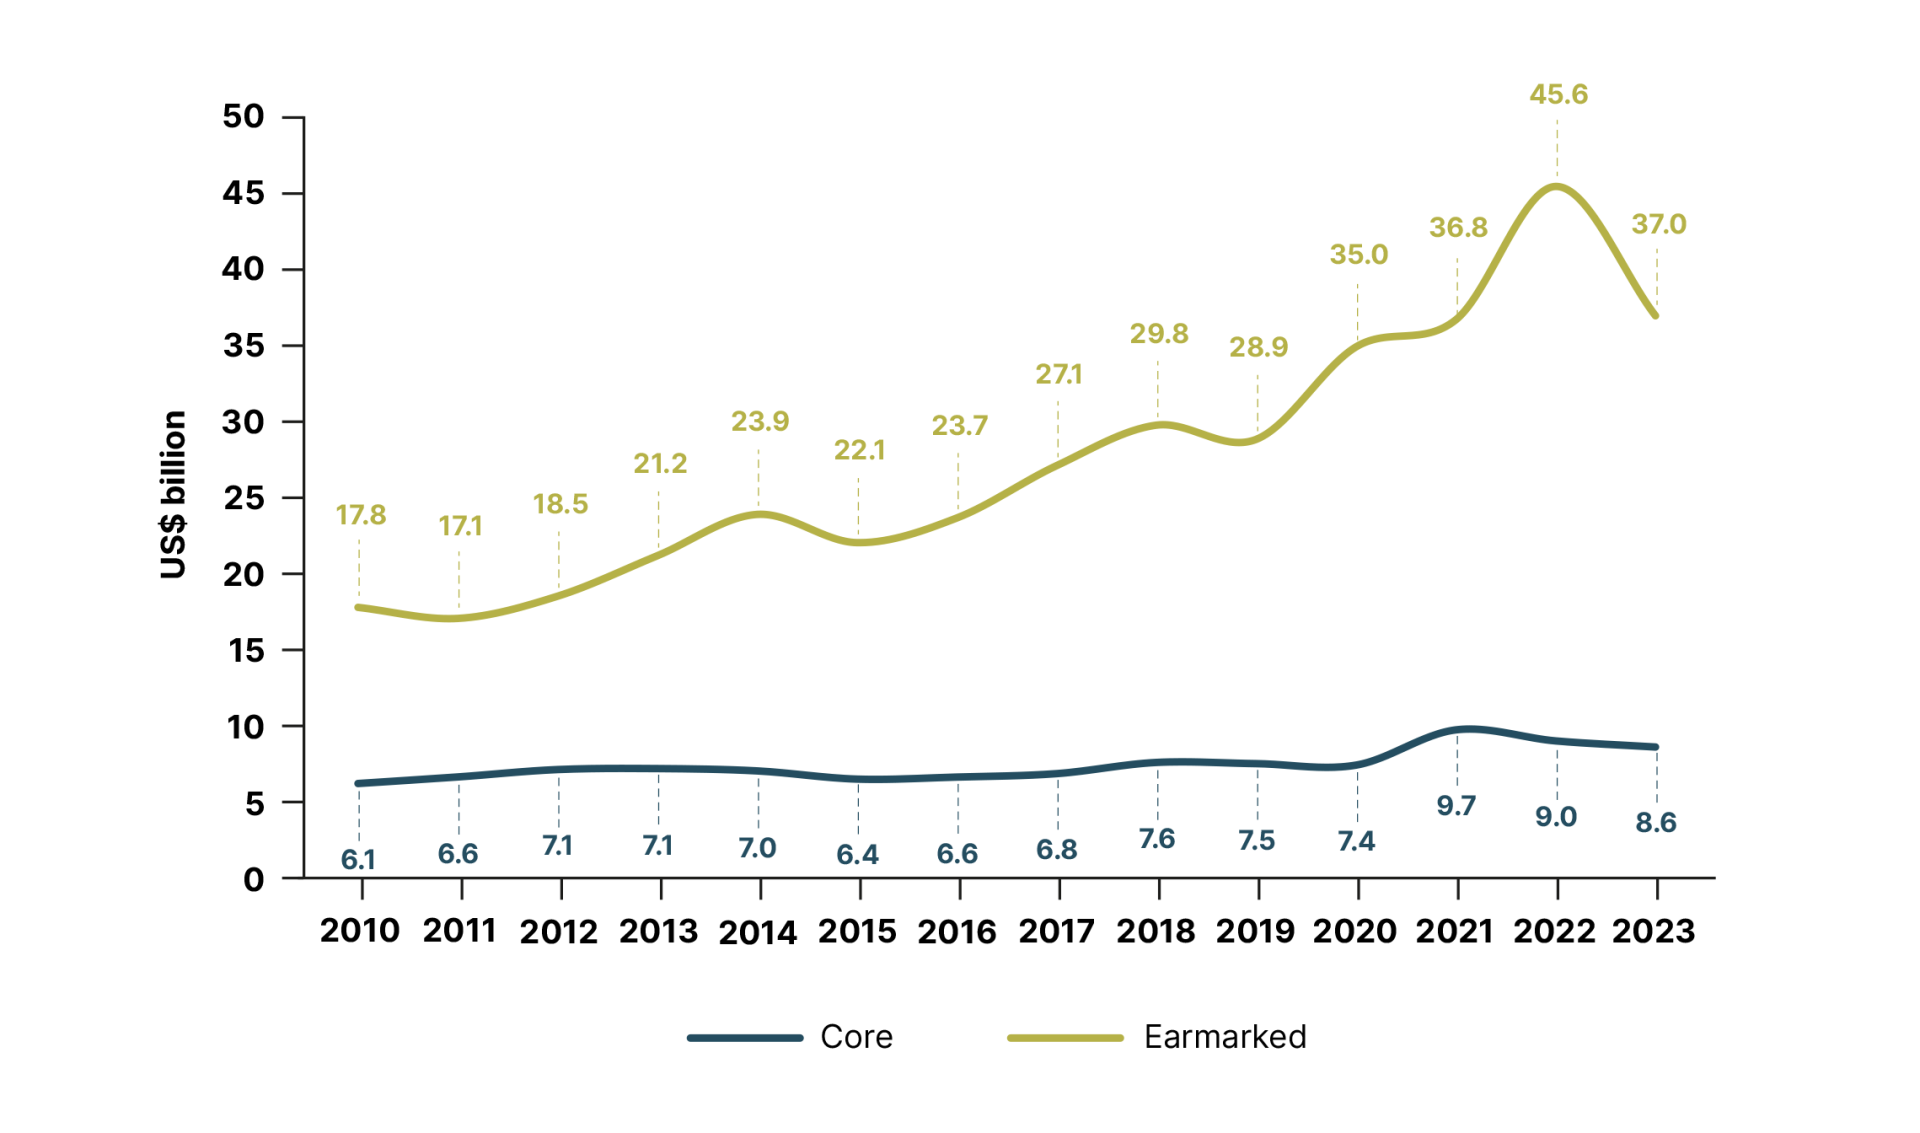
Figure 13 Total core and earmarked contributions for UN development and humanitarian assistance, 2010–2023 (US$ billion)
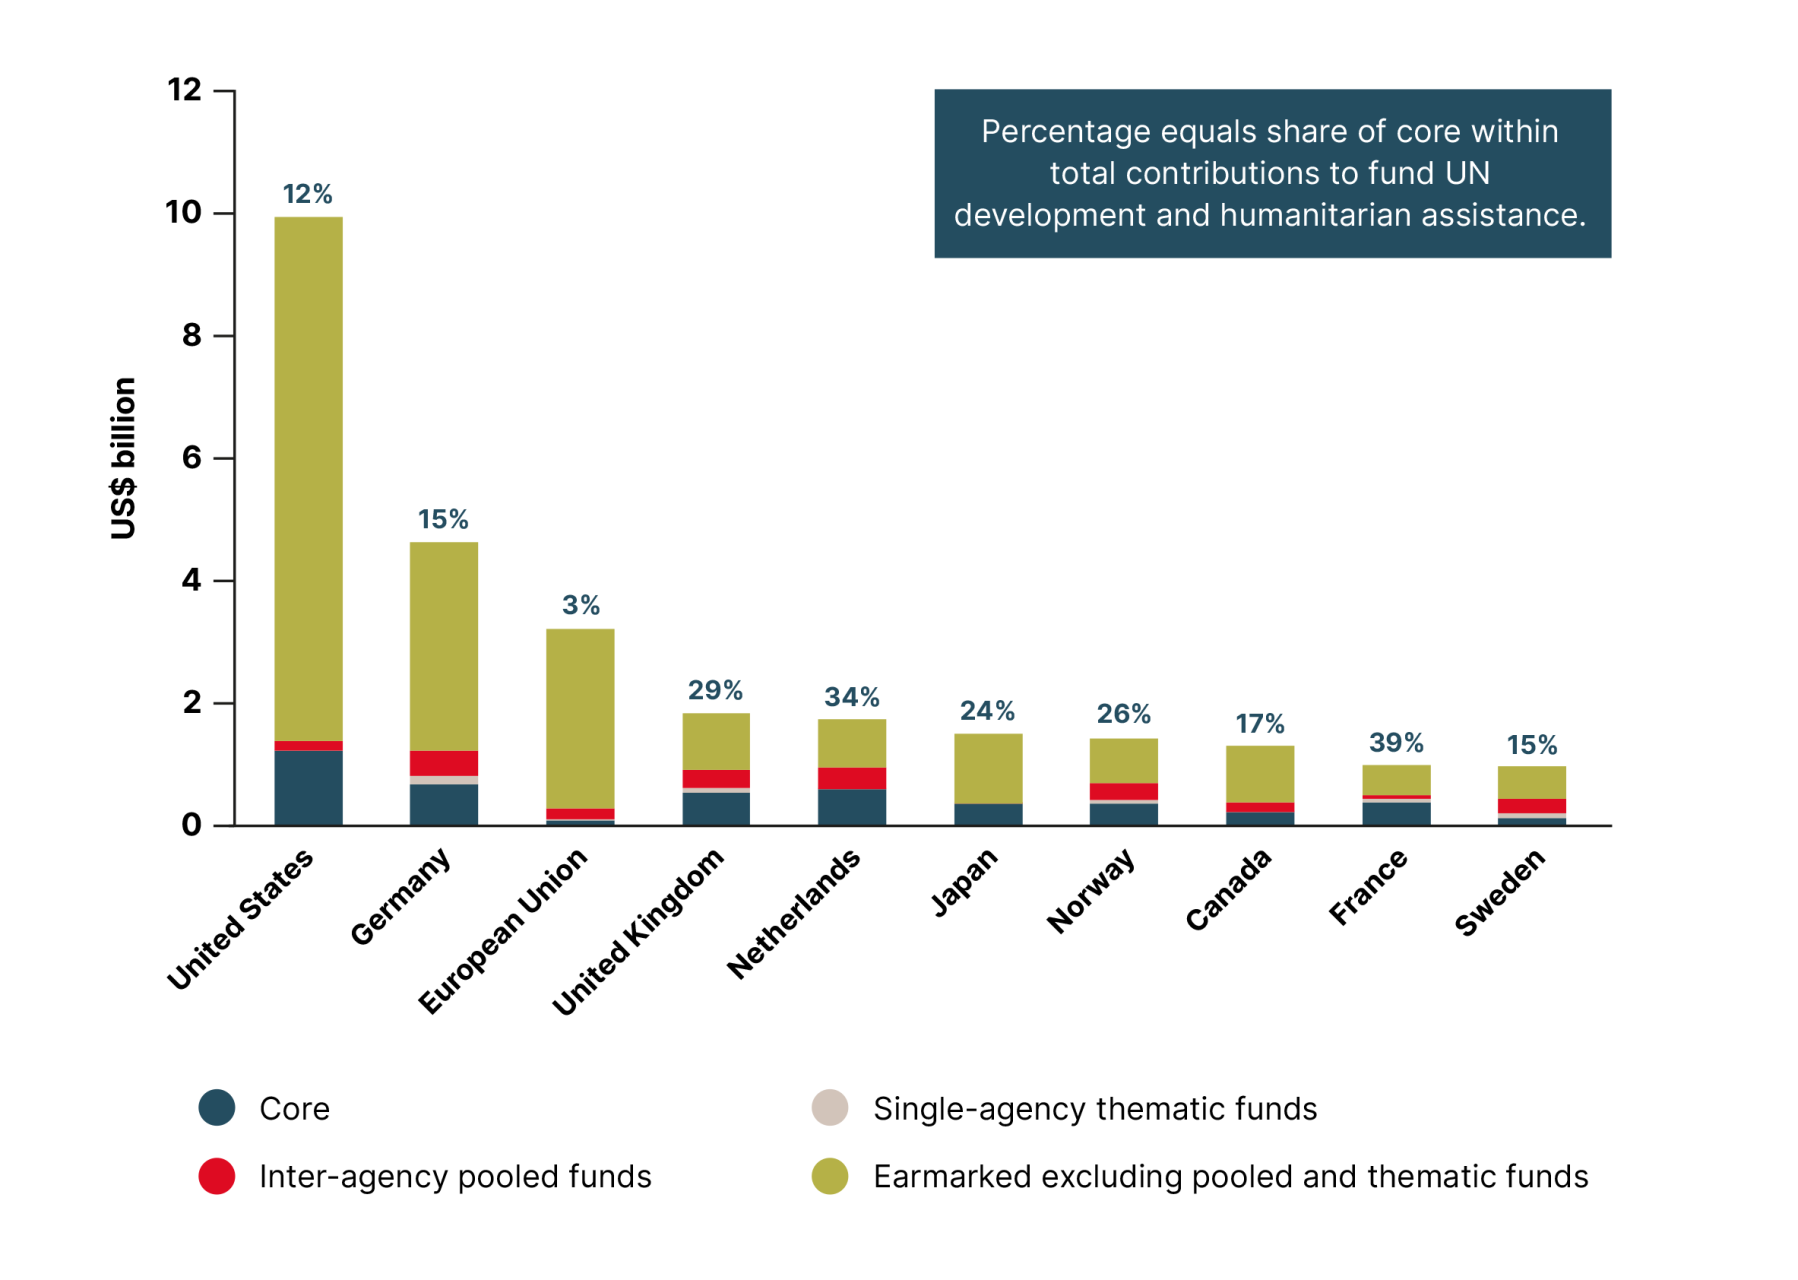
Figure 14 Funding composition for UN development and humanitarian assistance: Top OECD-DAC member state contributors, 2023 (US$ billion)
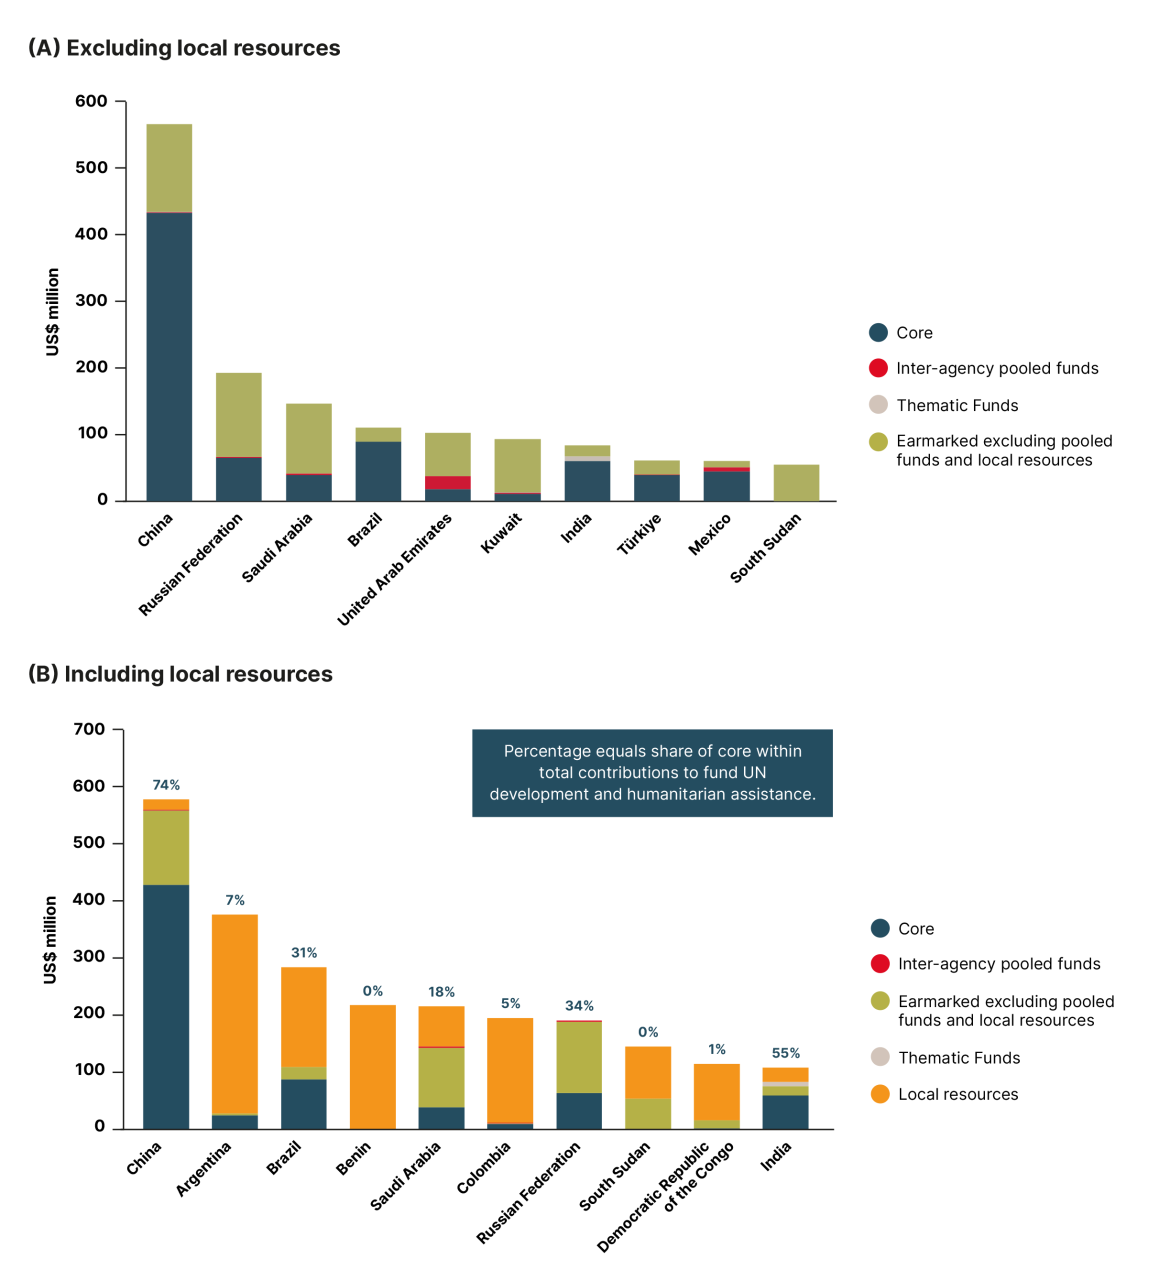
Figure 15 Funding composition for development and humanitarian assistance: Top non-OECD-DAC member state contributors, 2023 (US$ million)
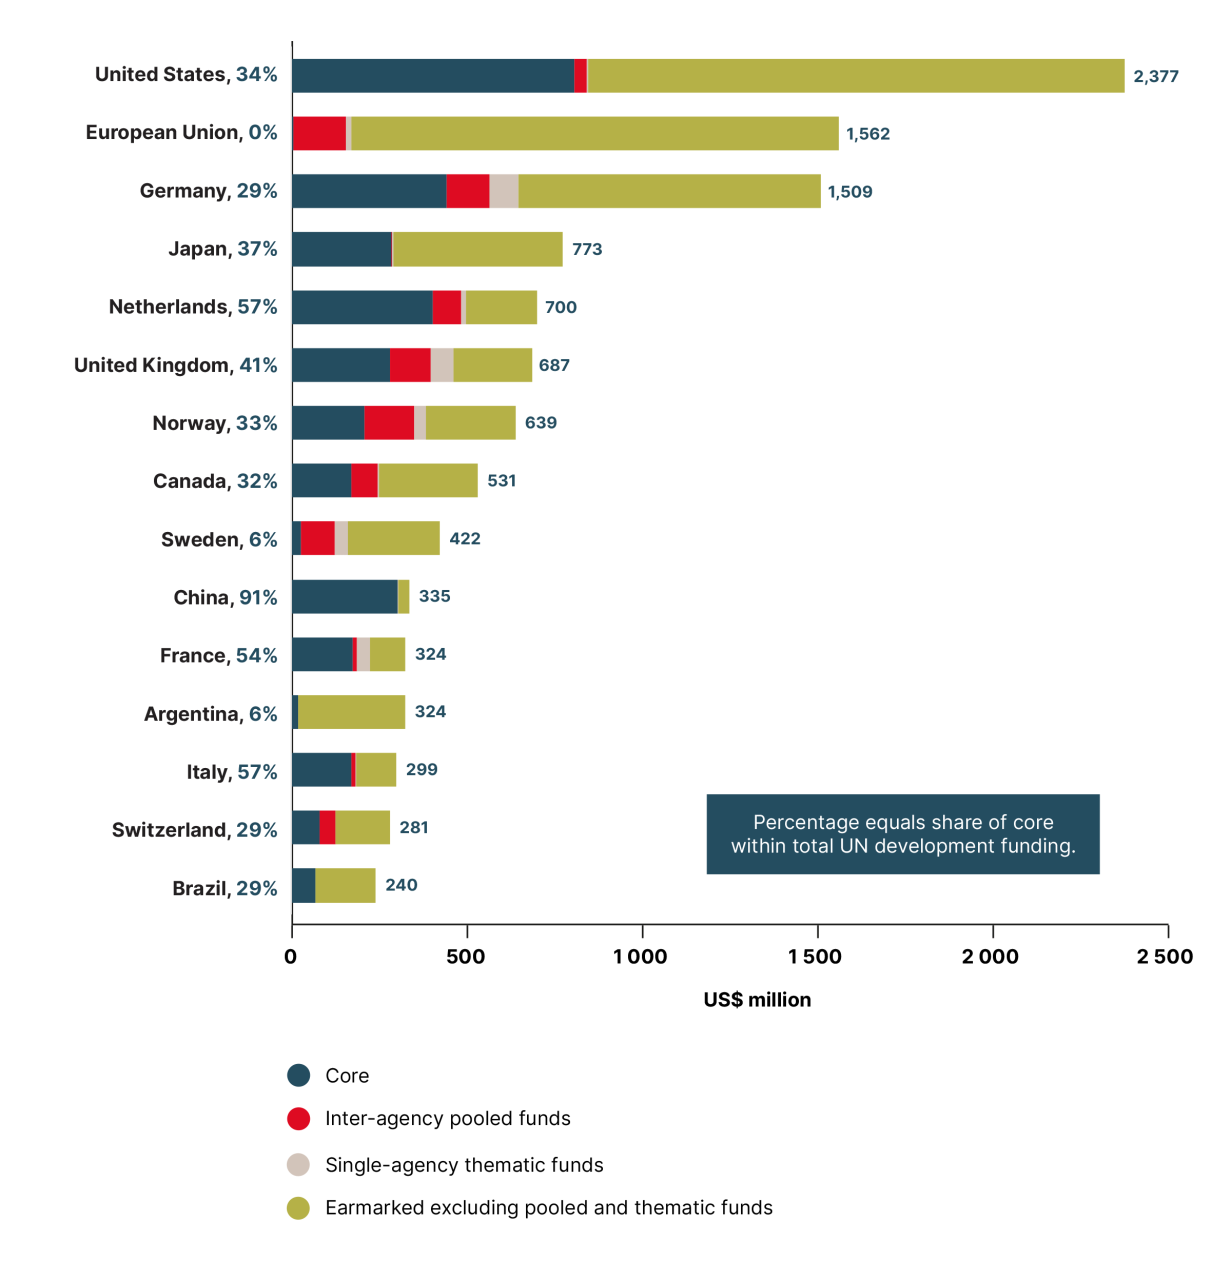
Figure 16 Funding composition for UN development assistance: Top Member State contributors and the EU, 2023 (US$ million)
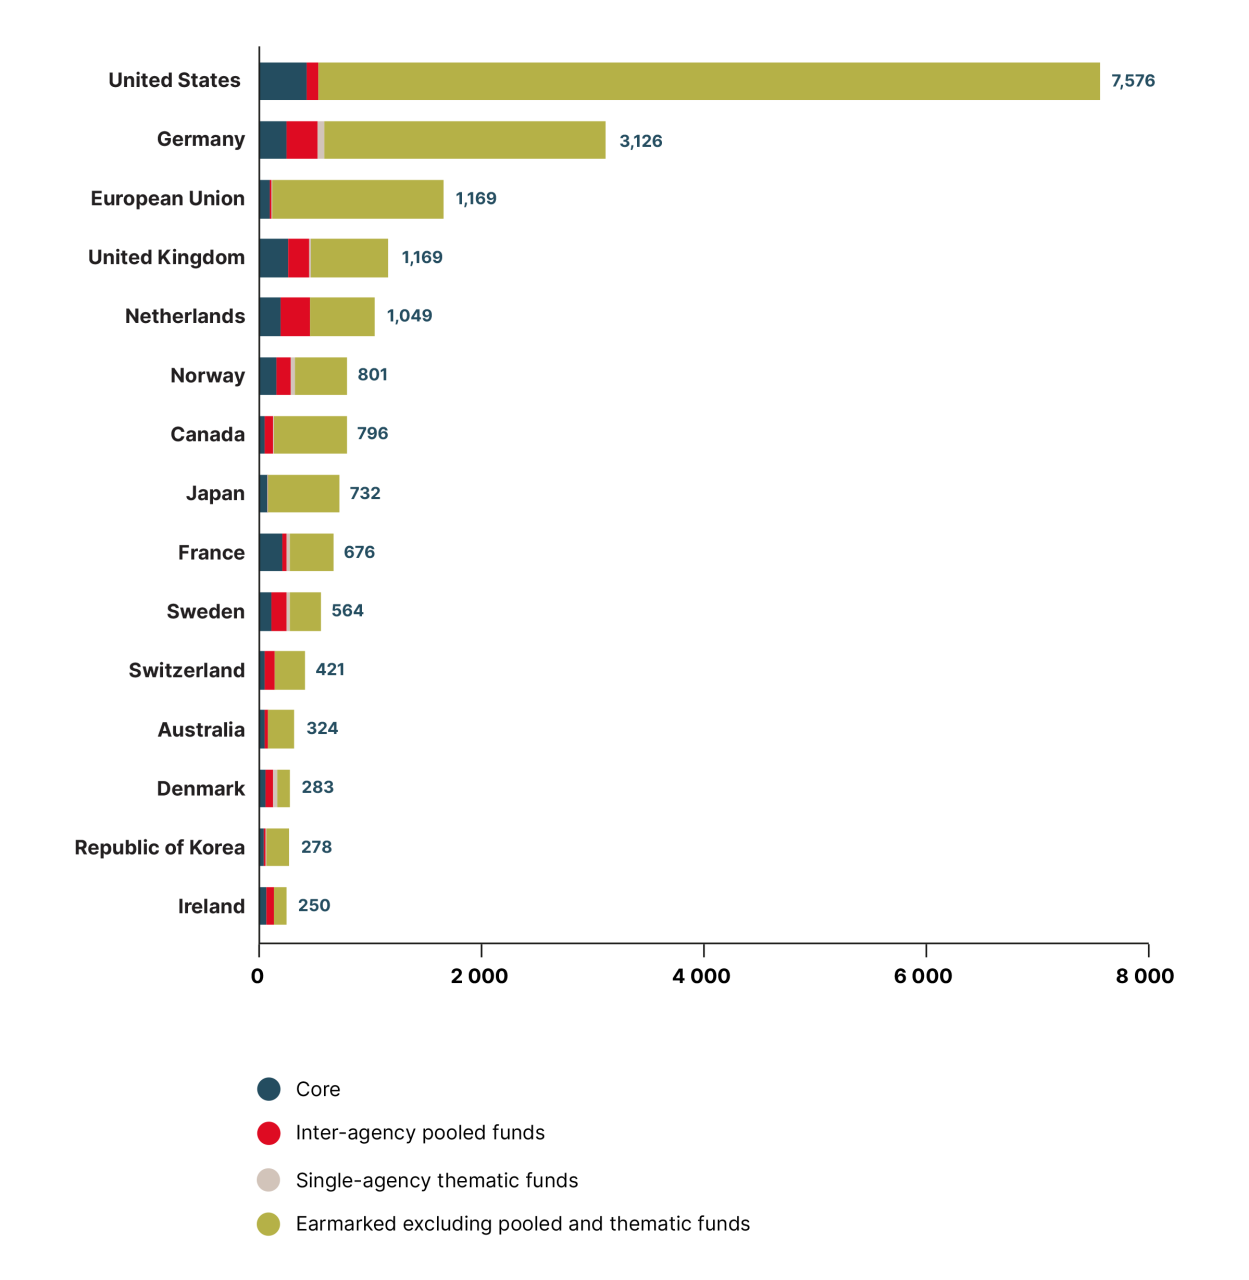
Figure 17 Funding composition for UN humanitarian assistance: Top Member State contributors and the EU, 2023 (US$ million)