logo-fundation logo-un
  • About us
  • UN Financing
    UN Funding short
    • UN Funding
    • Total revenue of the UN system
    • Funding instruments
    • Funding sources
    • Contributors
    • Inter-agency pooled funds
    • Funding out of total ODA
    UN Allocations short
    • UN Allocations
    • Total expenditure
    • Humanitarian and development expenditure
    • Expenditure linked to SDGs
    • Expenditure in crisis-affected countries
    Explore the data
    • Explore the data
    • Figures and Tables
  • Marketplace of ideas
    Marketplace of ideas Column 1
    • Climate Financing
    • COVID-19 Response
    • Global Public Goods
    • Health Financing
    • Humanitarian Financing
    • Innovative Financing
    • Multilateral Financing
    Marketplace of ideas Column 2
    • Normative Financing
    • Peacebuilding Financing
    • Pooled Financing
    • Prevention Financing
    • Private Sector Financing
    • SDG Financing
    Marketplace of ideas
    • Explore all essays
  • Other resources
    Key Resources
    • Acronyms and abbreviations
    • Links to data sources
    • Key Definitions
    • Previous Reports
  • The latest
  • Home
  • About us
  • UN Financing
    • UN Funding
      • Total revenue of the UN system
      • Contributors
      • Funding instruments
      • Funding out of total ODA
      • Funding sources
      • Inter-agency pooled funds
    • UN Allocations
      • Total expenditure
      • Humanitarian and development expenditure
      • Expenditure linked to SDGs
      • Expenditure in crisis-affected countries
    • Explore the data
      • Figures and tables
  • Marketplace of ideas
  • Other resources
  • The latest
    • Search

Footer
  • Cookie Notice
  • Privacy Notice
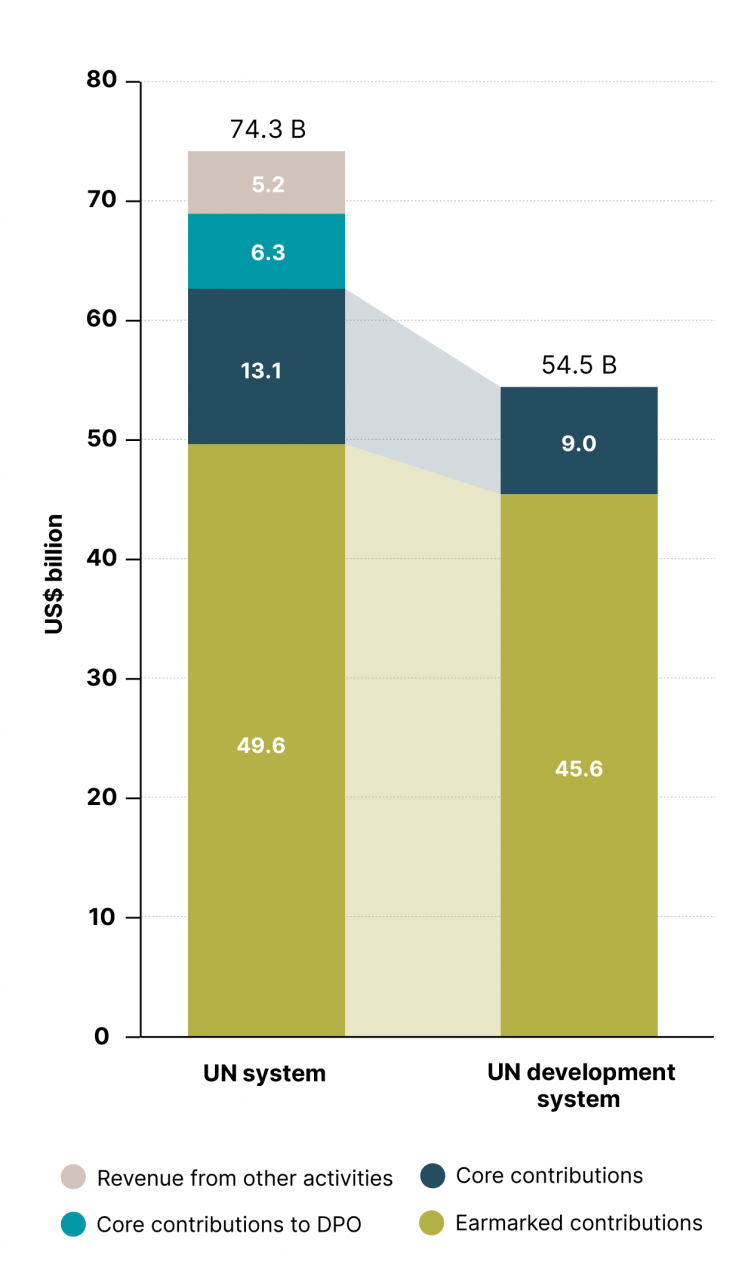
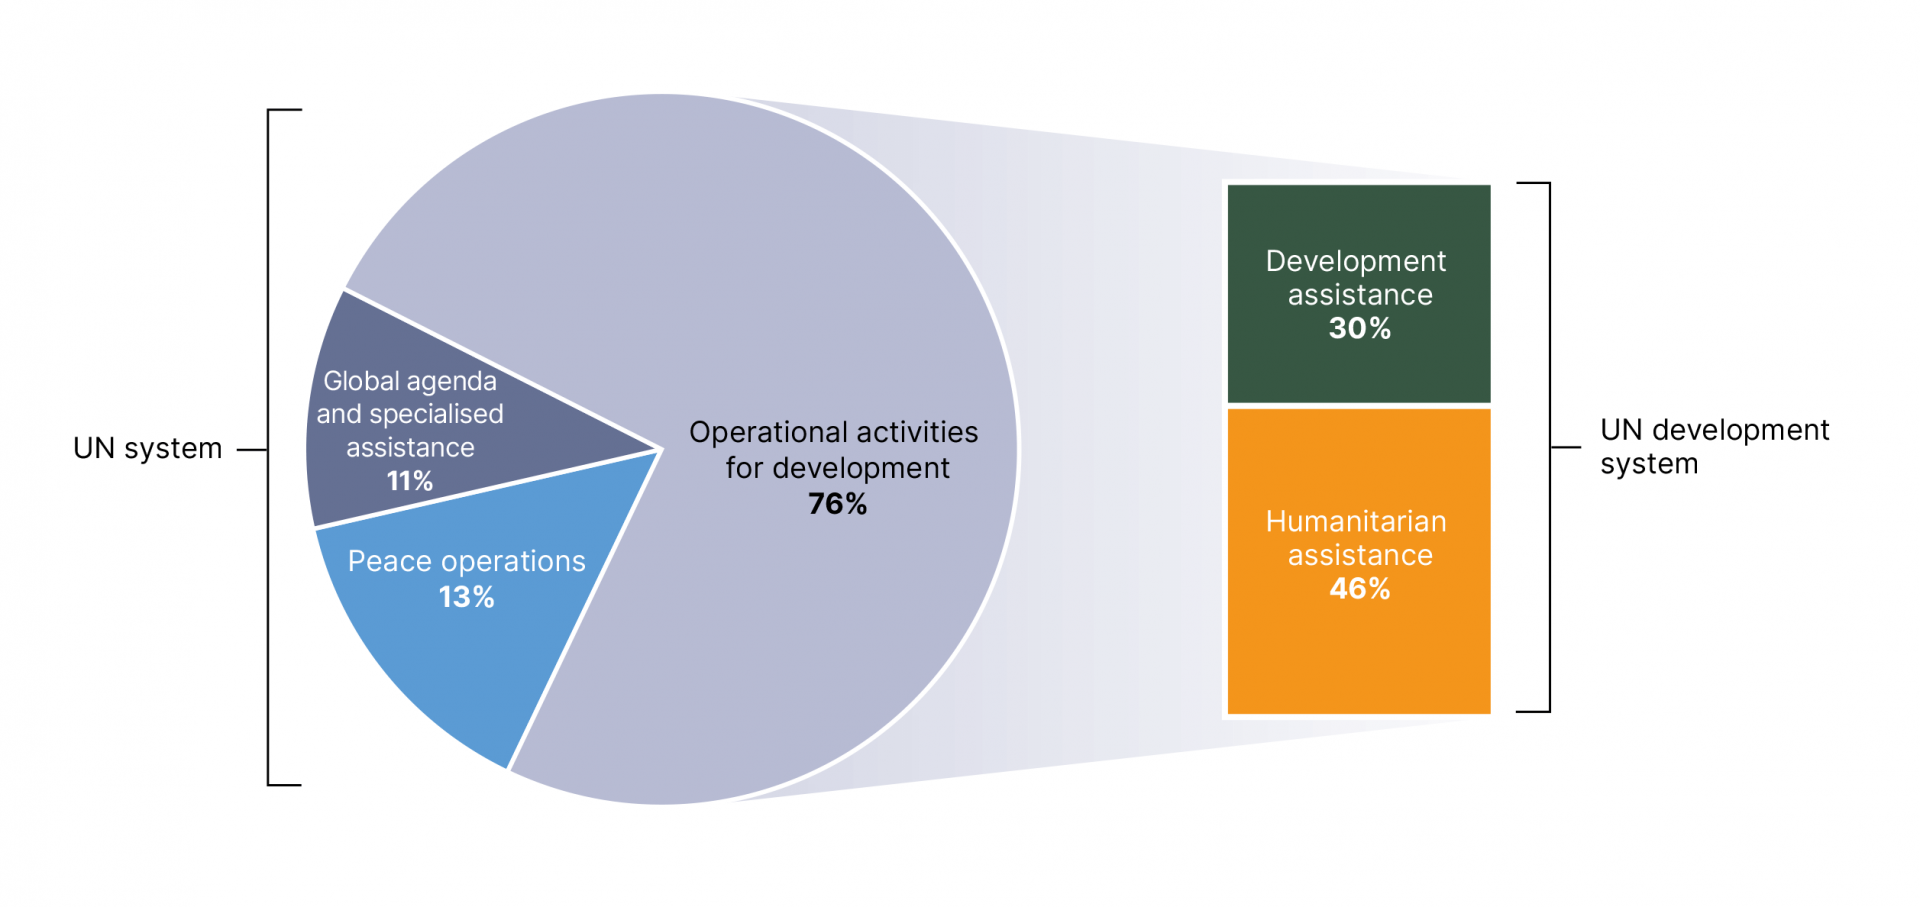
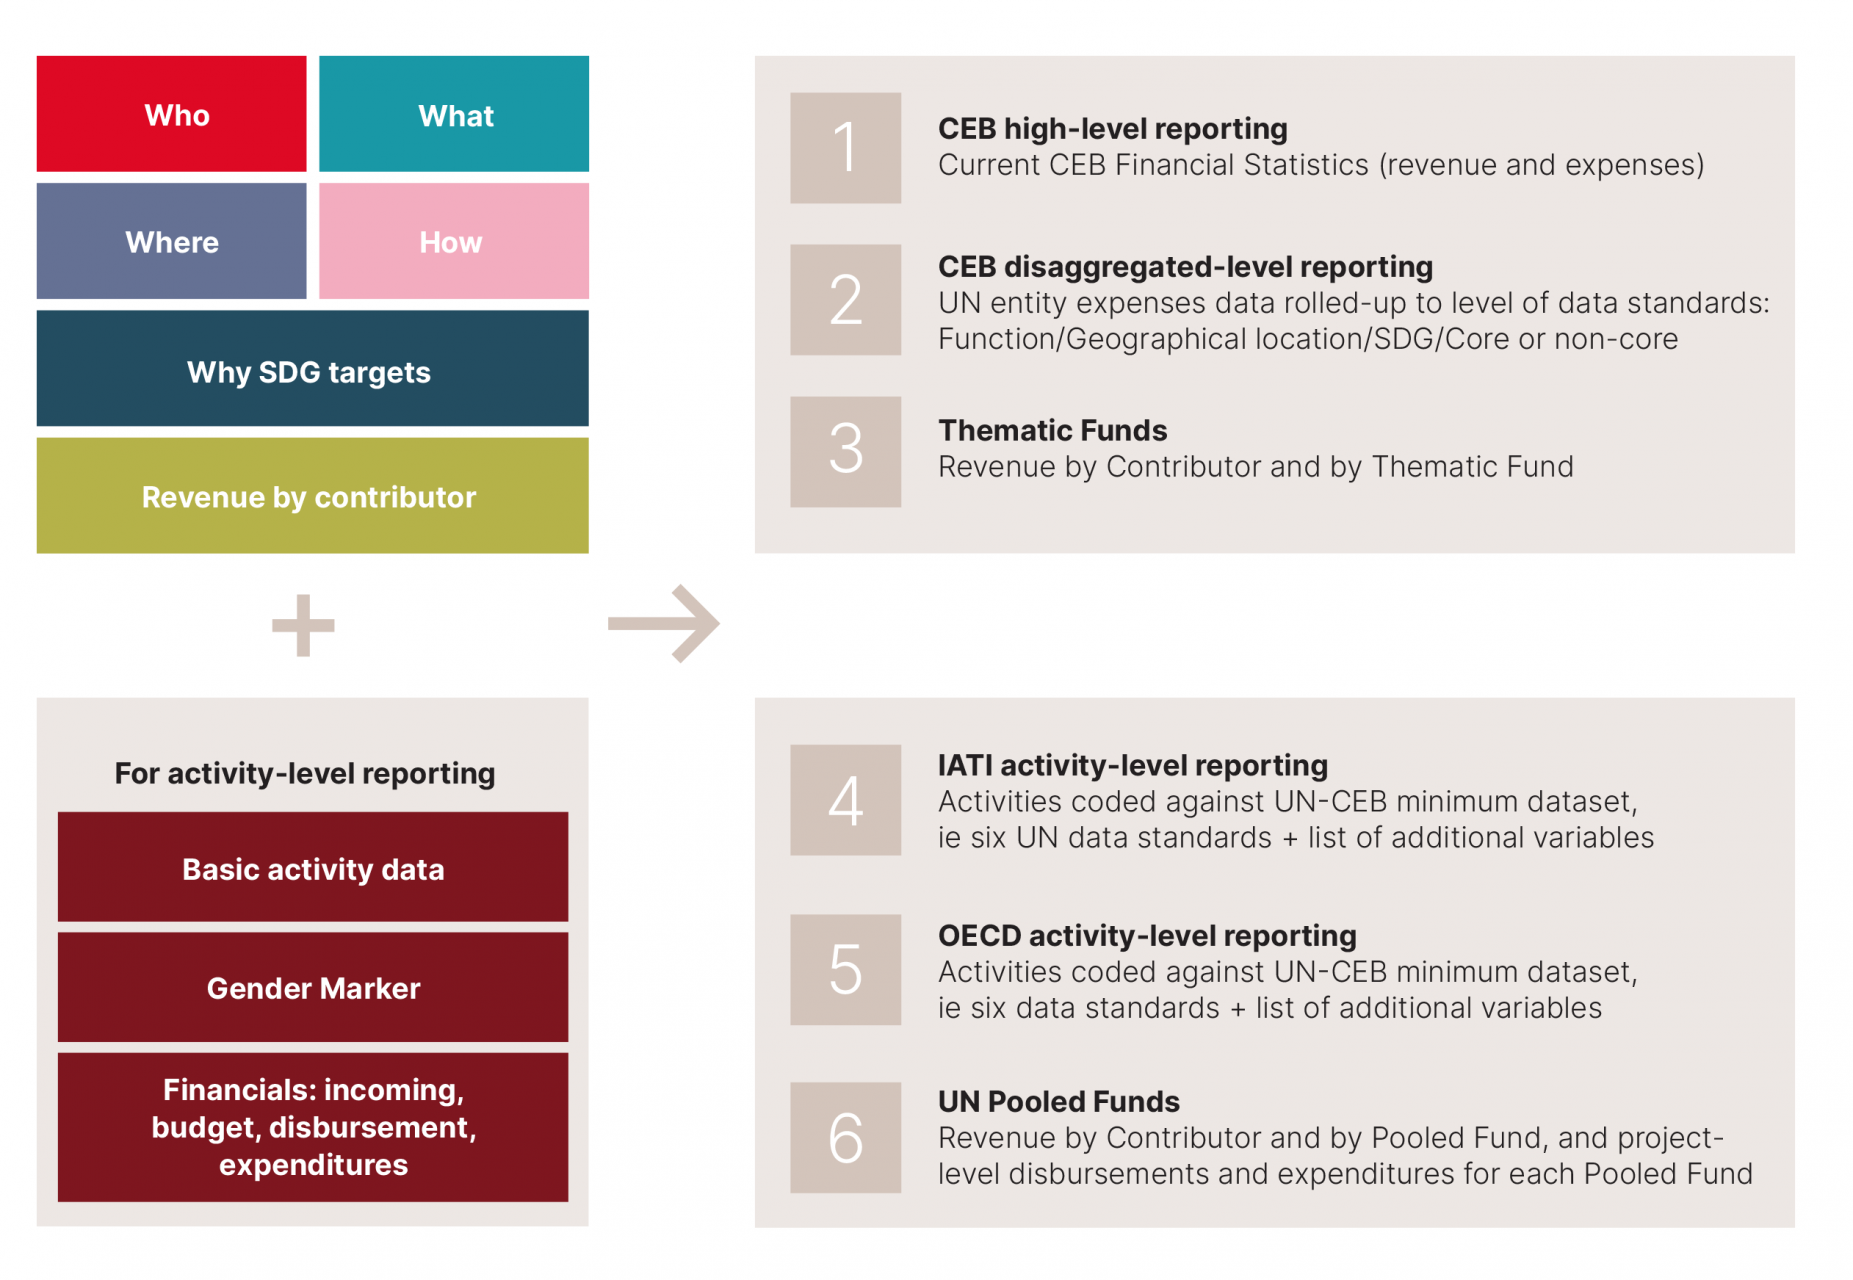
Explore the data
Figures and tables
Taking data quality to the next level
Filter
2022 Table 4: Total expenditure of the UN system by entity, 2010–2020 (US$ million)
Table 4
Total expenditure of the UN system by entity, 2010–2020 (US$ million)
2022 Table 5: Total expenditure of the UN system by entity and function, 2020 (US$ million)
Table 5
Total expenditure of the UN system by entity and function, 2020 (US$ million)
2022 Flowchart: Flows from top contributing countries to UN entities, 2010- 2020
Flowchart
Flows from top contributing countries to UN entities, 2010- 2020
2022 Box 1 Figure 1: Contributions to the UN system and UN development system, 2020 (US$ billion)
Figure 1
Box 1: Contributions to the UN system and UN development system, 2020 (US$ billion)
2022 Box 2 Figure 2: UN system expenditures by function, 2020
Figure 2
Box 1: UN system expenditures by function, 2020

Pagination

  • First page « First
  • Previous page ‹ Previous
  • Page 1
  • Page 2
  • Current page 3

Share this page

  • UN Funding
  • Marketplace of ideas
  • Other resources
  • Latest
logo-fundation
Dag Hammarskjöld Foundation
Övre Slottsgatan 2
SE-753 10 Uppsala
SWEDEN
logo-un
Multi-Partner Trust Fund Office
Bureau for Management Services, UNDP
304 East 45th Street, 11th Floor
New York, NY 10017
USA
Footer
  • Cookie Notice
  • Privacy Notice
© 2022 Dag Hammarskjöld Foundation