Figure 35
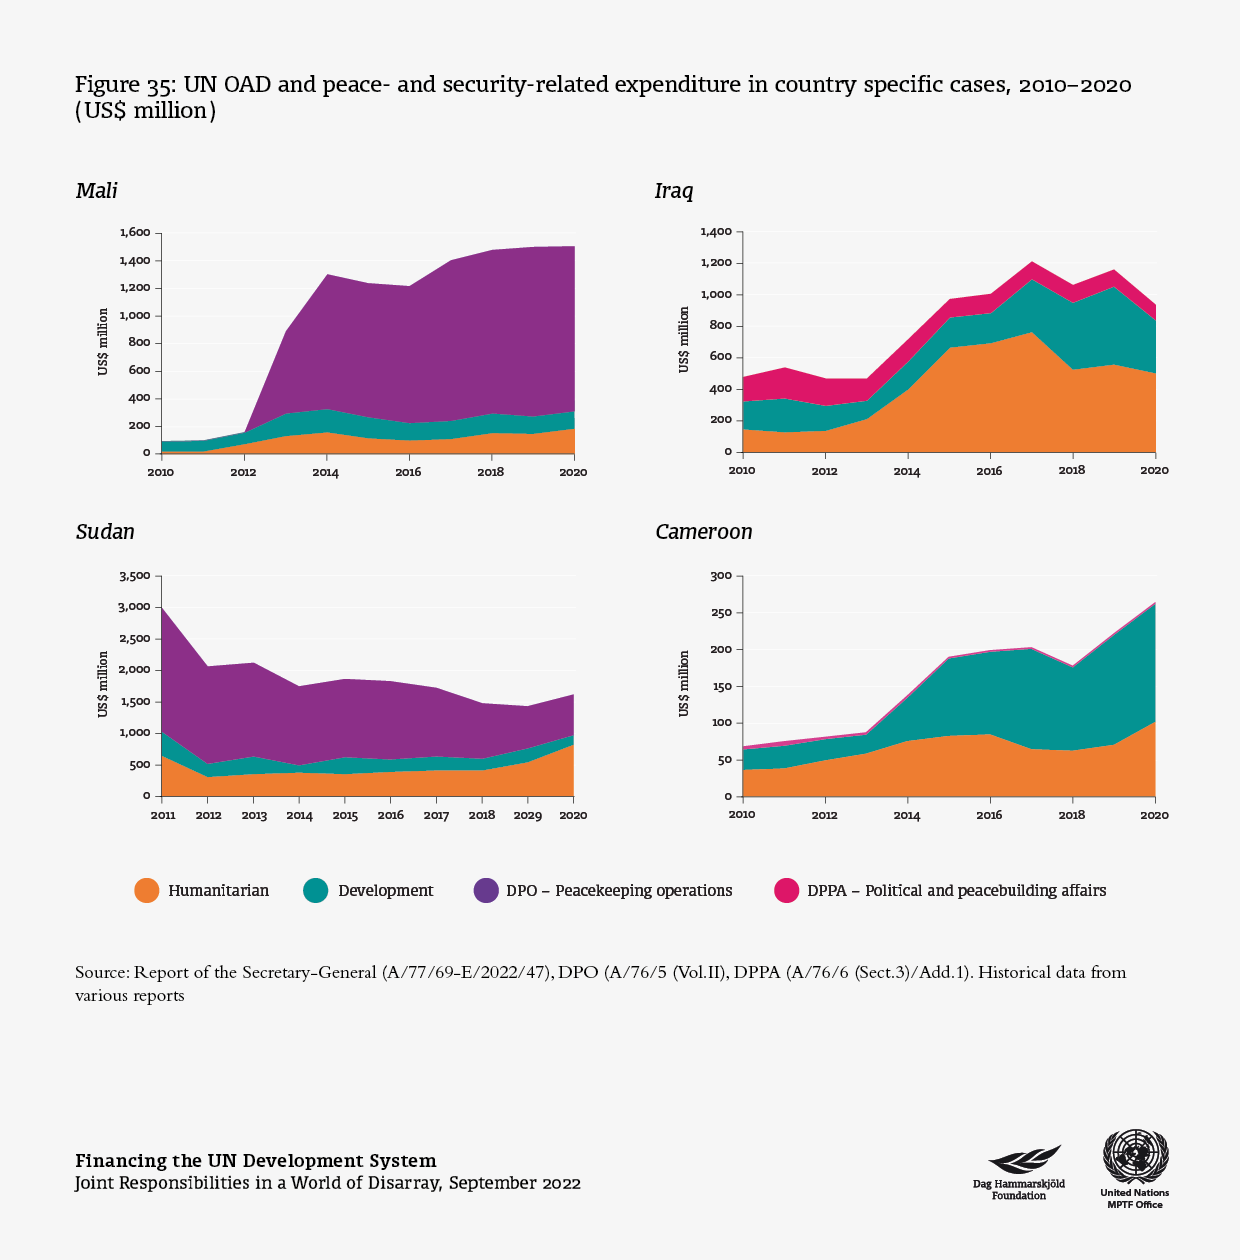
UN OAD and peace- and security-related expenditure in country specific cases, 2010–2020 (US$ million)
Download
Image

Source:
Source,4:0R0 eport of the Secretary-General (A/77/69-E/2022/47), DPO (A/76/5 (Vol.II), DPPA (A/76/6 (Sect.3)/Add.1). Historical data from various reports – see End Notes to Figures and Tables
- < previous
- all
- next >
- 128 of 202