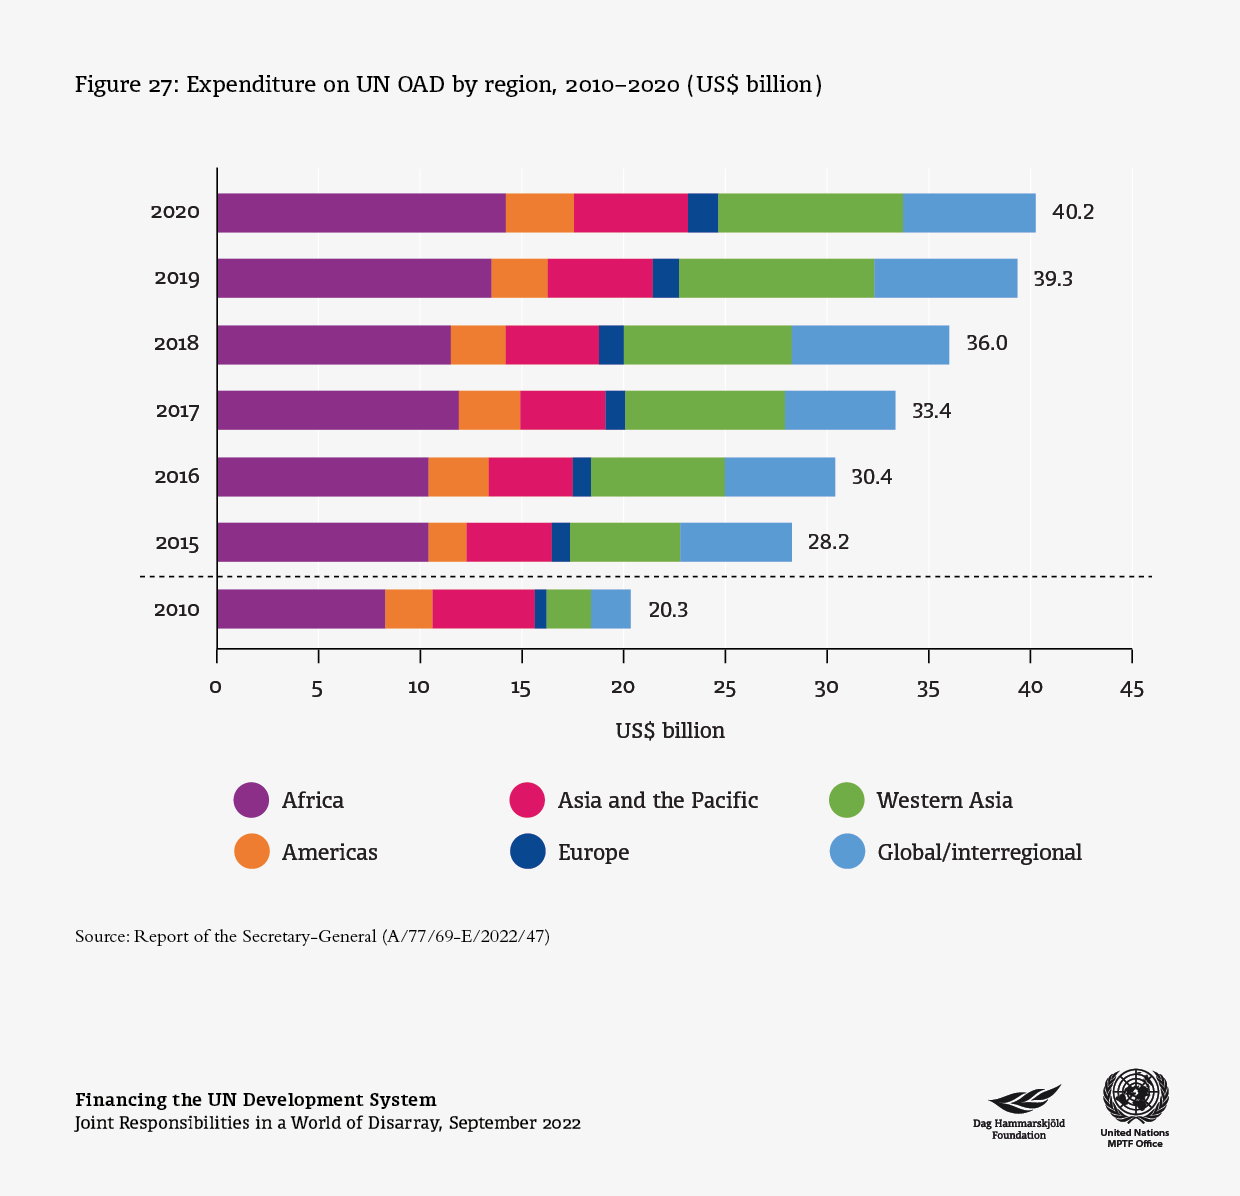
Figure 27
Expenditure on UN OAD by region, 2010–2020 (US$ billion)
Download
Image

Source:
Source: Report of the Secretary-General (A/77/69-E/2022/47)
- < previous
- all
- next >
- 102 of 202